
Vol. XV, No. 3, April 2015
- Editor's corner
- The scoop on social media usage and users
- The future of laser tag - prosperity or Digital Darwinism?
- Is your business on the search engine maps?
- Engaging Millennials in the workforce
- More on declining vacations and trips
- Part 1: Where many feasibility studies go wrong
- The most common reasons startups fail
- Families with kids eating out less
More on declining vacations and trips
Our last Leisure eNewsletter included an article The no vacation trend continues. As a follow-up to that article, we've dug into the Bureau of Labor Statistics' Consumer Expenditure Interview Survey data to examine what it shows in terms of vacation trends (people going on vacation, taking trips at least 50 miles from home or taking overnight trips closer to home). What we found is not a pretty picture. Americans are traveling less than the did before the Great Recession. Here are some graphs to show what's happening.
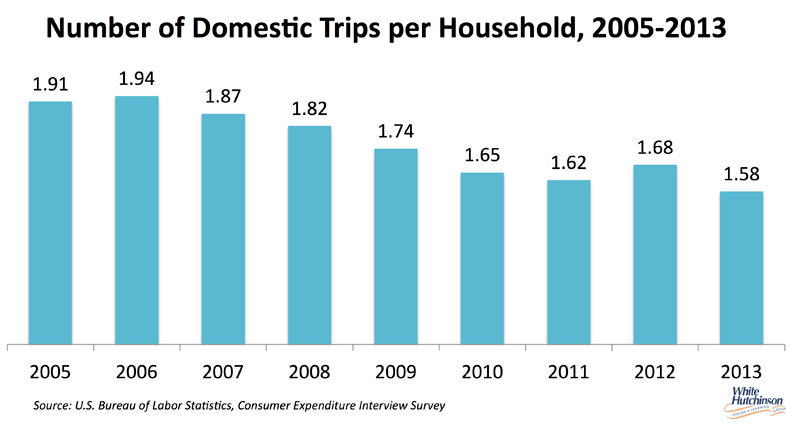
The average number of trips and vacations that American households make per year is down by almost one-fifth (19%) since its peak in 2006.
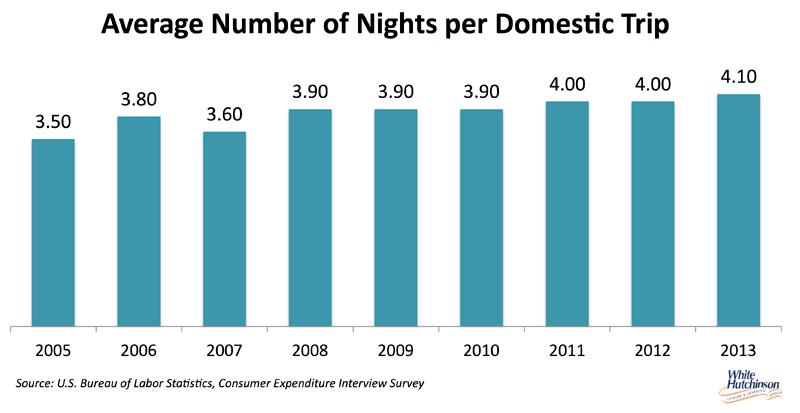
When people did take a trip, the average number of nights was up by 1/6 (17%), so the average total number of nights per year has remained fairly constant at around 6.5 nights.
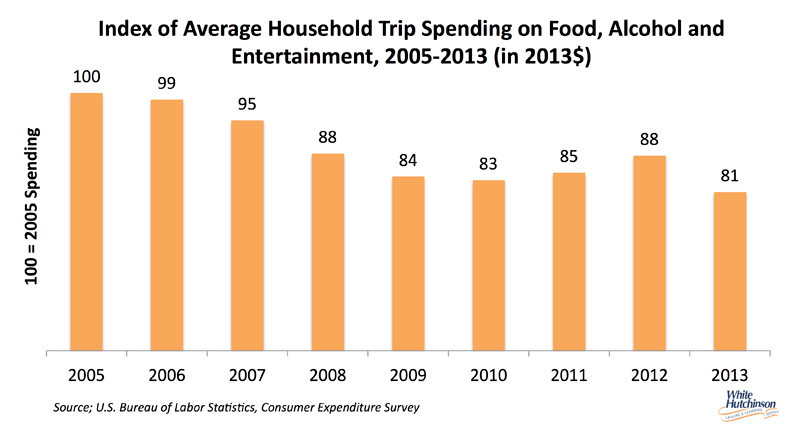
However, average household inflation-adjusted spending on food, alcoholic and non-alcoholic drinks and fees and admissions for entertainment during total trips taken each year is down by 1/5 (19%).
When we dug deeper into the data, I found that average spending decreased the most for the lowest 80% of income households.
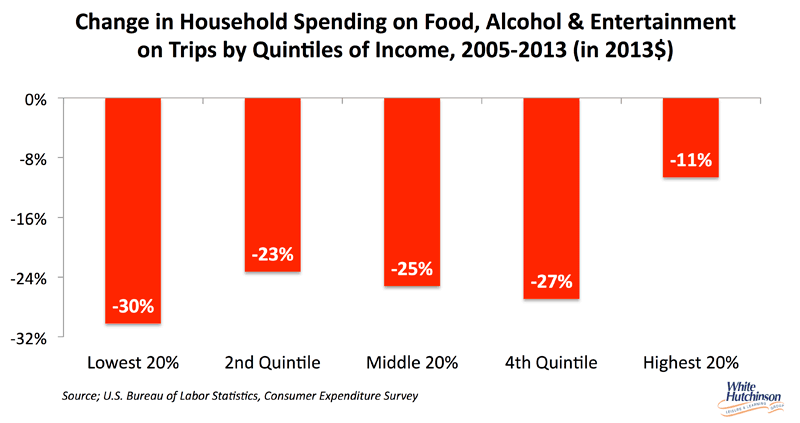
Looking at the spending for just entertainment fees and admissions on trips and vacations, we found the same pattern with a one-quarter (26%) decline in average household spending from 2005 to 2013 and the highest income quintile of households showing the smallest decline. The highest income quintile of households, those households with $95,000+ incomes, accounted for 56% of all that spending in 2013.
Vol. XV, No. 3, April 2015
- Editor's corner
- The scoop on social media usage and users
- The future of laser tag - prosperity or Digital Darwinism?
- Is your business on the search engine maps?
- Engaging Millennials in the workforce
- More on declining vacations and trips
- Part 1: Where many feasibility studies go wrong
- The most common reasons startups fail
- Families with kids eating out less