
Vol. XIV, No. 10, December 2014
- Editor's travelogue
- Last chance to save $100 on FEC education for success, nothing less
- Trends for 2015
- White Paper - The Perfect Storm: LBE disruption & opportunity
- The great beer abandonment
- Arcade bars
- 35 million households visited an agritainment farm this summer and fall
- Understand who your competition is
- Chuck E. Cheese's goes educational
White Paper - The Perfect Storm: LBE disruption & opportunity
This white paper is a must-read for anyone developing, owning, managing or working for a location-based entertainment venue or working in the industry, especially the FEC industry. The white paper explains the disruptive shift in how we fill our leisure time and consume entertainment that is significantly changing the entertainment competitive landscape and what it takes to be successful in the location-based entertainment industry today and in the future. We have included a lot of graphs to make it easy to understand the data presented.
A number of trends have all come together over more than a decade to create a Perfect Storm that has transformed the American consumer and their behavior, including a shift in how and where we socialize and consume our entertainment. This Perfect Storm has caused a major disruption to location-based entertainment (LBE) venues. First we'll describe all the winds of this Perfect Storm that have created a New Normal and a challenging entertainment landscape for LBEs. Then we'll discuss their impact, implications and its opportunities.
The Shrinking Middle Class
Long before the Great Recession, what was once the heart and core of the American consumer, the Middle Class started its decline. Following are a series of graphs to illustrate the magnitude of the decline.
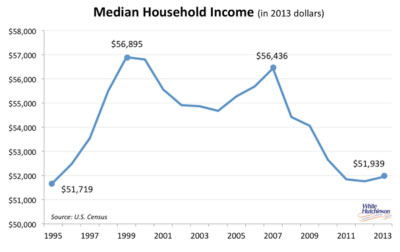
From its peak in 1999, median household income has declined by 8% (all the data we present in this white paper has been inflation-adjusted).
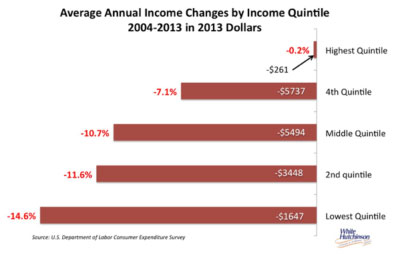
Looking at the last decade, incomes have basically held steady for the top 20% of income households and at the same time have decreased significantly for the 80% of households with lower incomes. The lower the incomes, the greater the percentage decline they have suffered.
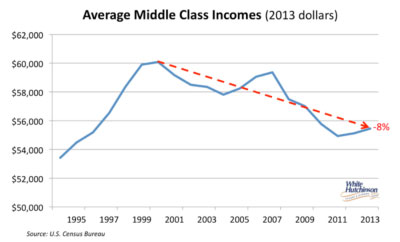
Average Middle Class incomes (the middle 60% of income households) have declined by 8% since 2000.
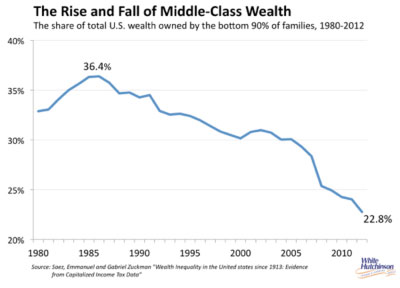
The wealth of top 10% of households has risen significantly while it has fallen for the other 90% of households.
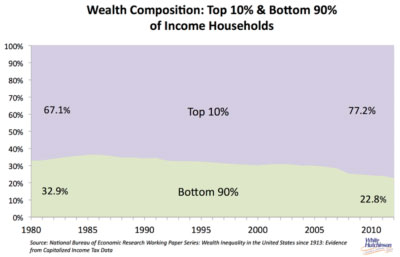
From a 1986 peak of 36.4%, the bottom 90% of income households' share of all wealth declined by more than a third to 22.8% in 2012.
A July 2014 report by the Federal Reserve points to the precarious state of the majority of US households who risk poverty or bankruptcy in the event of job loss, accident or unforeseen medical expense. The study found that almost one-half (48%) of American households couldn't raise $400 for an unexpected emergency expense without borrowing money or selling possessions.
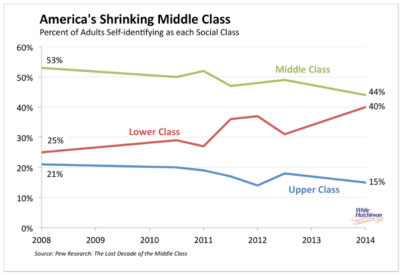
Many Americans clearly understand that they have dropped out of the Middle Class. The Pew Research Center reported in January 2014 that the proportion of Americans who identify themselves as Middle Class decreased from 53% in 2008 to 44% in 2014, while the number identifying themselves in the lower-middle and lower classes increased from 25% in 2008 to 40% in 2014.
Increasing segments of the population no longer have the incomes, and more importantly, the discretionary incomes that they used to. The size of the Middle Class has shrunk and the size of the lower classes has grown. What remains of much of the Middle Class is increasingly squeezed to stretch their declining incomes, resulting in far less discretionary spending. Many are living paycheck to paycheck. In fact, a September 2014 national survey by McKinsey & Co found that 40% of American households are living paycheck to paycheck and that 40% of families earning less than $75,000 are cutting back or delaying purchases.
The Great Recession
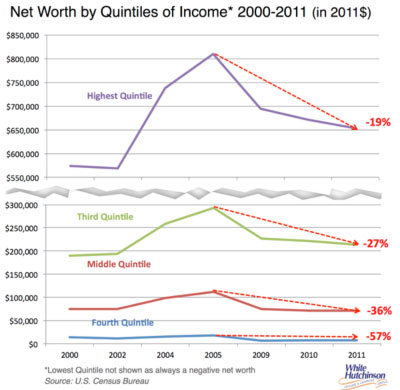
Although the Great Recession was not the sole cause of the decline of the Middle Class, it did contribute to it when many households, especially middle and lower income ones, suffered unemployment or a sudden drop in income. All income categories saw a drastic decline in net worth both in the stock market and home values, with many going upside down on their home mortgages. Many lost their homes through foreclosure. From 2007 when the recession began to 2013, the median net worth of households decreased by 40% from $135,700 to $81,400 according to an analysis of by PEW Research of Federal Reserve consumer finance data.
As this graph illustrates, the lower the household income, the greater the decline in wealth since right before the Great Recession hit.
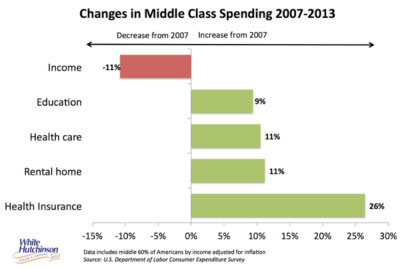
Here's the impact that both declining wealth and income has had on spending by the Middle Class since the Great Recession.
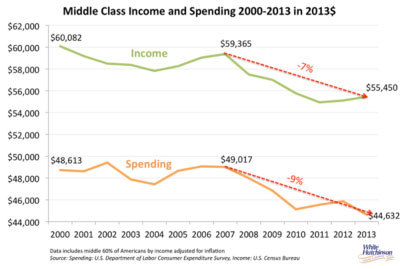
Middle Income household spending declined by 9%.
While the Middle Class was getting hit with declining incomes and wealth, they were also getting hit with the increased cost of many necessities.
This economic shock and stress has changed the value equation and buying behavior of most Americans, and especially the Middle Class. McKinsey's latest Consumer Sentiment Survey found that “ Almost 40% [of consumers] say they will probably never go back to their prerecession approach to buying. 29% say they now have new attitudes and values about spending... Cautious spending behavior is the new normal and is unlikely to change in the near future.”
There is no longer conspicuous spending. Now it is conscientious mindful spending, or what sometimes is called frugal spending. For much of the middle and lower income classes, frugal means price, as their discretionary spending has become more or totally limited. And for those that do have discretionary dollars to spend, it is all about value; am I getting my money's worth for the price I pay even if the price is higher than less expensive options? This is especially true for the higher income households. For them it is almost never about price, but rather value. They'd rather pay a higher price for a premium product or experience than a lower price for a mediocre one.
The Rising Importance of Affluents
All types of businesses are feeling the impact of the eroding Middle Class. In retail we are seeing the decline of retailers such as J.C. Penney and Sears whose wares squarely targeted the Middle Class. Loehmann's, where for years Middle Class shoppers hunted for marked-down designer clothes, has been liquidated. Mid-tier market restaurants such as Olive Garden, Red Lobster and even McDonalds are struggling to maintain sales. Foot traffic at Olive Garden and Red Lobster has dropped for every quarter but one since 2005. Regional casinos that targeted the Middle Class are finding that their customers are not betting as much. Midscale hotels such as Best Westerns are seeing minimal growth.
Yet at the same time, those businesses that cater to the affluent customers, or what we might also call the upper-middle class and above income customers, are growing. Those households constitute approximately 20% of all households (Basically the upper-Middle Class consists of people with personal incomes in excess of $70,000 who predominately live in households with two or more income earners with total household incomes of $100,000 to $200,000 in 2013. The upper class is basically considered to be households with incomes in excess of $200,000.). Higher end retailers such as Nordstrom are seeing increasing sales. The Capital Grille, a high-end restaurant owned by the Darden chain who also owns Oliver Garden and until recently Red Lobster, is seeing spending up 5% annually over the past three years. Luxury casinos such as the Wynn and Venetian in Las Vegas are booming. Revenue per room at high-end hotels including the Four Seasons and St. Regis grew 7.5% in 2013.
We now have what it called a bifurcated consumer market. The Middle Class center of consumers and their spending has shrunk leaving a market basically split into the two ends, bargain and luxury markets. As John G. Maxwell, head of the global retail and consumer practice at PricewaterhouseCoopers summed it up, “As a retailer or restaurant chain [or other type business], if you're not at the really high level or the low level, that's a tough place to be. You don't want to be stuck in the middle.”
Leisure Time Inequality
Just as we have a growing inequality of incomes and wealth, we also have inequality in leisure or free time. However, this time it is reversed. The higher socioeconomic people, the ones with the most incomes, have the least leisure time.
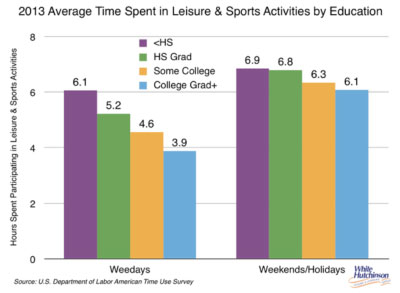
People with the highest incomes and highest discretionary incomes to spend on entertainment have the least amount of leisure time to devote to it. Where high school graduates have 40 hours of discretionary free time per week, college graduates only have 32 hours, or 8 less hours per week.
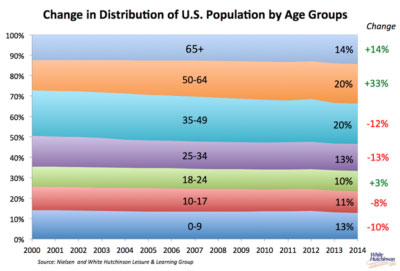
Changing Age Demographics
The age composition of the American population is undergoing changes. Although the press seems obsessed with analyzing the Millennial generation, the proportion of young adults in the total population is actually on the decline as well as is the number of children.
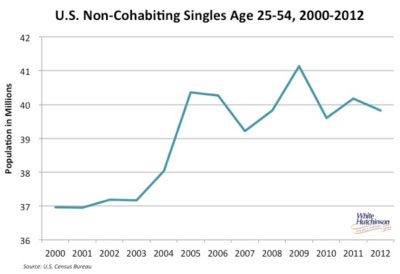
The number of single non-cohabiting adults is increasing.
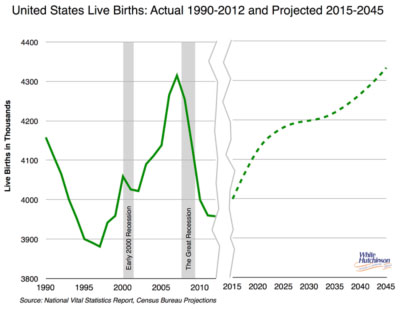
Since the Great Recession we are experiencing a baby bust. In 2013, the U.S. general fertility rate was at an all time-low, down 10% since 2007. The number of births each year has declined for six straight years, dropping 9% since its peak in 2007. Kenneth Johnson, a demographer at the University of New Hampshire, estimates that if the pre-2007 fertility rate had continued into 2013, there would have been 2.3 million more births in 2008-2013 and the 2013 birth rate would have been 4.5 million instead of its 3.9 million.
Research published this Fall from the Princeton University's Woodrow Wilson School of Public and International Affairs finds that these two trends will continue long into the future. It found that women who were in their early 20s during a recession will have fewer children in both the short and long term, driven largely by the number of women who will remain childless at age 40.
The Census Bureau just recently released revised projections based on the ongoing baby bust. The projections show that births will not surpass the 2007 record high of 4,316,233 until 2044.
There is another age-related change known as KGOY (kids growing old younger) or what is also known as children's age compression. Here are a few examples:
- When boomers were growing up, Sesame Street was targeted to kids age 3-7. Now it is targeted to ages 3-4. By age 5 kids have moved onto other shows that used to only appeal to much older children.
- It used to be that girls in the 6-10 age range were the prime market for Barbie and other dress-up dolls. But nowadays, Barbie is really big only with 3-to-5-year-olds. After that, she's considered pretty babyish.
- 20 years ago the last toy purchase for a child used to be around age 11, today it is around age 9 or sometimes as young as age 8.
Age compression, children becoming more sophisticated for their age in what appeals to them, has shrunk the age range that children's entertainment centers appeal to including Chuck E. Cheese's.
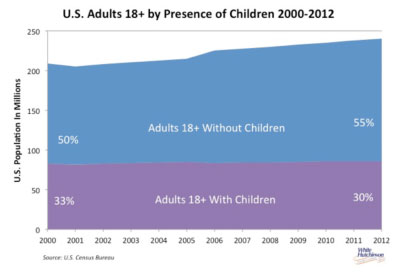
Along with the decreasing birth rate, the number of all adults, whether single, married or co-habiting, living in households without children is also on the increase.

Living Digital Lives
With the advent of the Triple Revolution - the Internet, social media and mobile technology (including the now ubiquitous smartphone) - we are seeing a seismic shift in how we are working and living our lives and spending our disposable incomes and free time on leisure activities. We are increasingly living our lives in the digital world rather than in the real world. We no longer need to visit bricks-and-mortar locations to conduct large portions of our lives. We can bank online, order merchandise online and in some cities even groceries. We can order home delivery meals any time and enjoy all forms of entertainment in the comfort of our homes or on the go on our mobile devices 24/7. We can stay in constant touch with our friends on social media and on our mobile screens. We can access any sports game, movie or any other media. We can take college classes. We can even take virtual spinning fitness classes from home.
Unlike a decade or so ago, there is no longer a need to leave home. We can just cocoon at home and enjoy much of the comforts and socialization of modern living without having to go out the front door. In fact, today we have digital cocooning on steroids called super-cocooning. One study found that 7% of the population are now super cocooners, rarely leaving their homes except for work. Most are younger adults.
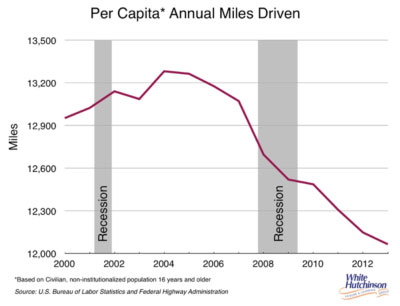
We have anecdotal evidence that points to the growth of cocooning, using the digital world to access what we used to do in person. People are driving less. When looking at miles driven per capita, there has been a 9% decline from its peak in 2004 to miles driven in 2013. Each person in America age 16 and older drove 1,184 less miles in 2013 compared to 2004.
Overall foot traffic at shopping malls, retail stores and restaurants is on a slow and gradual decline as well.
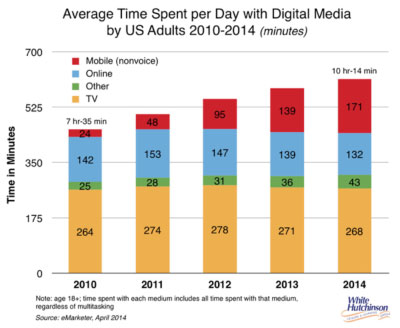
It is very clear that we are increasingly going to our digital screens to conduct our lives versus going to brick-and-mortar locations. The average amount of time Americans spend per day with digital media including television is on a continual rise. It has increased by 35% just over the last five years to over 10 hours per day (some studies report it is 11 hours per day when you include all electronic media). This sure doesn't leave much time for other activities. Today adults spend more time on digital media than watching TV and more time on mobile screens than online on desktop and laptop computers.
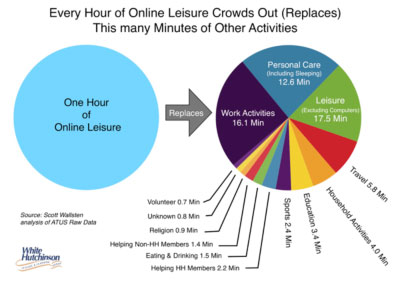
We have solid research from Scott Wallsten at the National Bureau of Economic Research that online screen time does in fact displace time that would otherwise be spent on real world activities. He measured the offline (real world) activities that are crowded out by our online leisure. His analysis of online leisure included social media, browsing and instant messaging, but did not include time spent online gaming, watching videos or emailing. He had to exclude those activities from his analysis because of the way the time data he used was collected and coded. His results show a crowding out effect of online leisure on offline leisure. He found that for every additional hour the average American spends with online leisure, they spend roughly 17 less minutes doing some other type of leisure like watching TV, going out for entertainment and socializing in more traditional ways. If he had been able to analyze data on online gaming, watching videos and emailing, he surely would have found even more displacement of time spent with real world leisure activities.
Entertainment spending is clearly shifting from bricks-and-mortar locations to the digital screen. Over the last decade average household spending on all forms of entertainment actually increased by almost one-fifth (+19%). However the amount spent on entertainment of all types of location-based entertainment, cultural and sports venues declined by one-quarter (-24%) while the amount spent for digital and its equipment and services grew by one-quarter (26%).
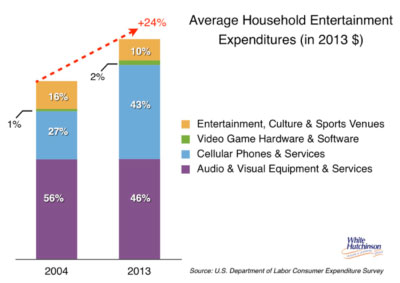
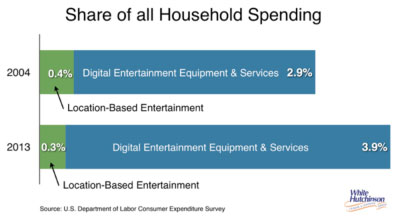
From 2004 to 2013, digital entertainment spending has grown from 2.9% to 3.9% of all household spending while LBE spending has shrunk in share from 0.4% to 0.3%.
Not only is the digital world and its equipment displacing money spent in the real world, it is beginning to shift spending from one product category to another. Screen-obsessed teenagers are shifting their spending from fashion clothes to fashion technology. They now favor tech over clothes. Logo tees and trendy strategically ripped jeans are no longer cool. Their social cachet now involves waving the latest in hand-held technology, which is considered equal parts function and fashion. Today teenagers use smartphones to signal status in the way men used to do with ornate watches. Teens are far more interested in playing on smartphones than hanging out at the mall where the teen clothing stores are located. They are far more likely to spend their money on iPhones and other tech gadgets and accessories than on clothes. As a result of this and other factors, sales at teenage apparel retailers are significantly down. Mainstays in the teen clothing industry like Abercrombie & Fitch, American Eagle Outfitters and Aéropostale, which dominated teenage closets for years, are being hit hard. Delia's and Deb Shops have gone bankrupt.
The digital world is having a disruptive impact on brick-and-mortar entertainment as well. As digital entertainment options expand and become extremely economical and free, consumers are shifting more of their leisure time and discretionary spending away from location-based entertainment (LBEs) options. We've already seen the impact on the physical media retail industry of digital downloadable MP3 music, downloadable or digitally ordered and delivered books and digitally streaming video, on the book, record, CD and video tape industries. We have witnessed the demise of their brick-and-mortar outlets including Circuit City, Musicland, Borders Books and Music, Tower Records, Hollywood Video and Blockbuster. For those industries, digital delivery over the Internet has significantly or almost totally replaced the physical world alternative.
Locations where we go, not to buy our entertainment content to take home with us, but rather to stay for the entertainment and to socialize is taking a disruptive digital hit due to the increasing amount of time we are spending in the digital world.
The Impact of this Perfect Storm
The shrinking Middle Class, the Great Recession, leisure time inequality, changing age demographics and the digital revolution have all converged to transform the spending behavior of the American consumer. We can see how these factors have impacted the bricks-and-mortar LBE by looking at the changes in spending and participation on location-based entertainment. LBEs can essentially be broken into two basic types based on where they are located in relation to their customers - community entertainment venues, near a person's home, or trip-based, on an overnight trip or more than 50 miles from home.
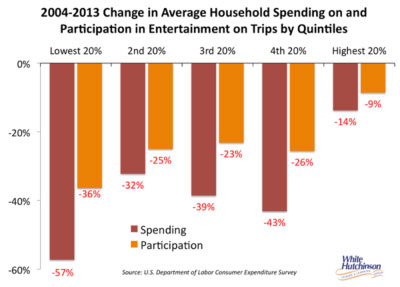
Trip-based LBEs have taken a serious hit over the past decade, with an overall 20% decline in participation (percent of households that attend) and a 28% decline in average household spending.
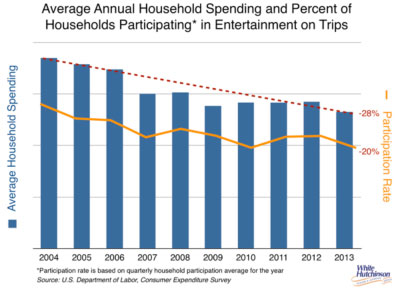
For trip-based entertainment, even the top 20% of income households reduced both their participation and average spending. The other 80% of income households have seen much more dramatic reductions, reaching more than a one-half reduction for average household spending by the lowest income quintile.
Since most of our company's work and this Leisure eNewsletter primarily focuses on community-based entertainment (CBEs), we'll drill down a little deeper for those type venues to see what the impact of the Perfect Storm has been on them.
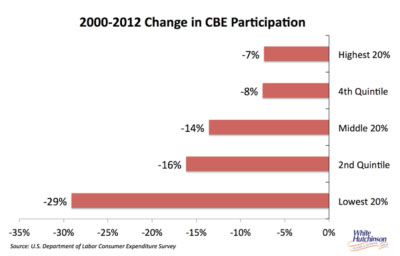
Since the beginning of the 3rd Millennium, average household spending on entertainment at CBEs has held steady. However, there has been a significant shift in socioeconomic market share. Overall household participation has decreased by about 1/8, with the lowest income households decreasing their participation the most.
Along with that, there has also been a marked shift in market share based on household incomes. In 2000, the top 20% of income households accounted for 42% of all CBE spending. In 2013, their share grew to 52%. The 4th quintile of income households have held steady at a 22% share. Households with the lowest 60% of incomes have declined from a 36% market share in 2000 to 27% in 2013.
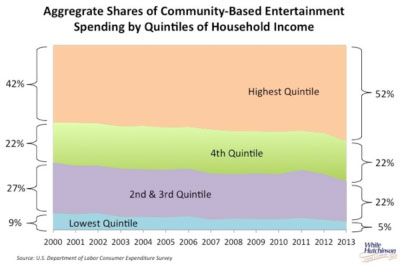
You might think of it this way. The highest 20% of income households now account for more than half of all spending (52%), the next 20% account for 22% of all spending and the bottom 60% only account for just slightly over one-quarter (27%) of spending. Simply put, the top 40% of income households now account for three-quarters (74%) of all CBE spending.
Here's something we found very fascinating and will discuss its implications later. Although the number of households attending CBEs is on the decline, when we analyze changes to the spending since the year 2000 by those who did attend, spending by participants has actually increased. When we break it down by quintiles of income, the lowest 20% of incomes households who participated decreased their annual spending, but the other 80% of attending households increased theirs, with the higher income households that attended showing the greatest increase in both dollars and percentage increase. Except for the poorest households, those households who are still participating at CBEs have increased their spending.
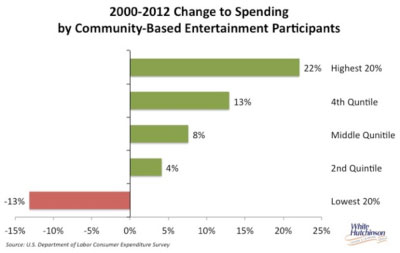
So what has been happening since the beginning of the 3rd Millennium is that fewer and fewer households are going to CBEs, but those that still do go are spending more.
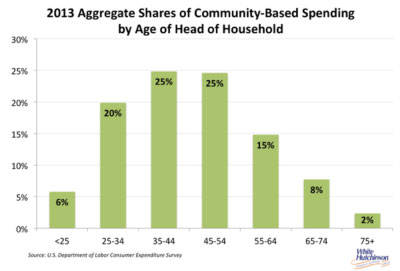
The greatest share of CBE spending comes from middle-aged households. These are the majority of households with children.
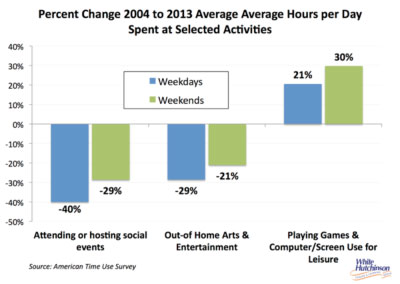
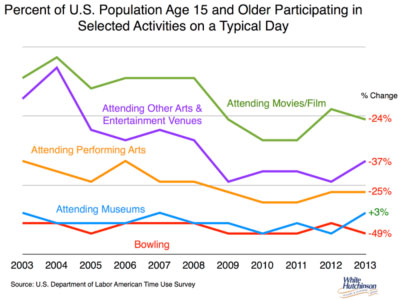
For just about every category of community-based leisure we examine, participation is down. This graph shows participation based on our analysis of data from the American Time Use Survey.
This graph uses other sources.
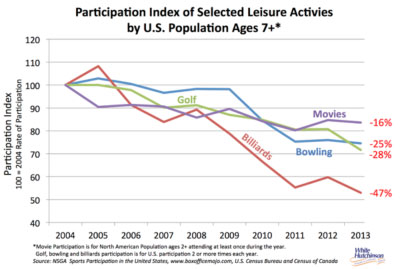
Although the percent decline in participation for some activities varies between the two graphs, the trend is very clear. Participation is down across the board at CBEs with the one exception of attendance at museums.
Implications
So here's the bottom line of the Perfect Storm's disruptive shift to CBE participation and spending:
- We have lost a large share of the Middle Class as potential customers.
- The proportion of all households attending CBEs, including family entertainment centers and hybrid bowling centers, has shrunk by about one-quarter over the past decade.
- There are clear signs that this long-term trend of shrinkage of market size may continue into the near future with the growing evolution, adoption and use of digital technology.
- The reduced number of people who are attending CBEs are spending more than in the past, so overall average household spending has basically remained steady (average also includes all those households that aren't attending).
- The share of all CBE spending by the upper-middle and higher income households, the Affluents who are about 20% of the population, has grown to more than half of all spending. Indications are their share will continue to grow into the near future.
- The top 40% of income households now account of three-quarters of all CBE spending.
- Middle-age households (head of household age 35-54) who are 36% of all households account for 50% of all CBE spending.
- The proportion of the population that is younger children is on the decline due to the Baby Bust.
- The proportion of single adults is increasing.
- The proportion of older adults is increasing.
- The proportion of families with children is on the decline.
- Time in the digital world is displacing time with real world socialization and out-of-home entertainment.
- Affluents, who have the most disposable money to spend at CBEs, have the least amount of leisure time to spend visiting compared to the lower incomes.
Opportunities
What the impact of the Perfect Storm means is that what used to be the target market for most CBEs, the Middle Class, has shrunk. The vast majority of attendance and spending is now coming from the higher-income households, predominately Affluents, who are mostly well-educated in white-collar positions. The Middle Class is no longer a viable target market.
Since Affluents have less leisure time than the less-educated and lower income population, when Affluents do leave their home to visit a CBE, they are looking for great value for the time they spend. They are looking for a premium, High Fidelity experience and they are willing to pay for it. It's far less about cost and far more about value to them. Our analysis clearly shows that the people who are still going to CBEs are spending more than they did in the past. This also includes some of the remaining Middle Class, who are going less often, but when they do go, they also are looking for a high quality, premium, High Fidelity experience. Their spending equation is more about value for the price. Our data also indicates they are willing to pay a higher price for a higher quality experience; they will trade up. Also important, especially to younger adults, is whether the visit experience is worth sharing on social media, as today social currency is becoming much more about the experiences you have than the possessions you own.
The premium, high quality, High Fidelity experience that CBEs need to offer includes far more than just the entertainment. The entertainment is only one of many components that have to come together to create a High Fidelity experience.
Food and beverage is now an important aspect of the CBE experience to the Affluents. It should be considered as an anchor attraction. The expectations of restaurant food and the overall experience have gone up dramatically in the past decade. Food expectations, especially for Affluents, are very high. We are now a foodie nation. The food and beverage offerings at a CBE are now critical to attracting and keeping guests.
So is the importance of the quality of the physical facility, its appearance, its finishes, its acoustics, and its comfort. The concept in the early days of an indoor FEC, entertainment in what was basically a warehouse interior, will not longer cut the mustard.
Just as critical is the quality of the hospitality. Just plain customer service no longer works. Attendees need to be treated as guests and made to feel they are valued guests.
When it comes to age demographics, the market for children's entertainment venues is definitely shrinking due to the ongoing Baby Bust and age compression. The only children's entertainment centers that will succeed in the future will need to be located in dense areas with a high concentration of young families in the child bearing years.
The family market is no longer the best market to target. It is shrinking. The great opportunity in the CBE industry is to target affluent adults, not just the Millennials, but also middle-age and even older adults. This of course requires serving alcohol. The great oxymoron of targeting and designing for adults is that you will still get a lot of families coming as well, whereas if you design for families, you don't get the adults. The size of the adult market far exceeds the size of the family market, which is slowly shrinking.
The overall market population has shrunk for all types of CBEs. Market share has clearly shifted to the Upper Middle Class and above. This means that trade areas that might have supported a CBE a decade ago may no longer be feasible for a CBE today. Today, to succeed, CBEs will need to be located in more dense trade areas that have a high share of Affluents.
Yes, the potential market population for CBEs has shrunk. But there is still great opportunity for those who understand who the target market is and how to design and operate to create the quality of experience to attract that market.
Additional reading:
- Births down, but don't despair
- Evidence of continuing long-term decline in marriages and births
- To win today, it's all about offering a High Fidelity experience
Vol. XIV, No. 10, December 2014
- Editor's travelogue
- Last chance to save $100 on FEC education for success, nothing less
- Trends for 2015
- White Paper - The Perfect Storm: LBE disruption & opportunity
- The great beer abandonment
- Arcade bars
- 35 million households visited an agritainment farm this summer and fall
- Understand who your competition is
- Chuck E. Cheese's goes educational