
Vol. VIII, No. 1, January/February 2008
The shifting nature of leisure time and expenditures
LBLs and LBEs are in the business of capturing the consumers' leisure-time dollars, which is White Hutchinson extensively researches how Americans spend both their leisure time and their leisure dollars on away-from-home-entertainment and food. Read on to find out about significant changes that are impacting the industry.
Since 2000, we have been researching how consumers spend both their leisure dollars and leisure time away from home as it relates to the location-based leisure (LBL) industry, one of the industries we work in. With the beginning of a new year, we thought we would share with our eNewsletter readers some of our findings on changes that have occurred in the U.S. in the past few years.
Part 2 of this article, which we'll feature in the next issue, will examine:
- Current and potential future events that may impact leisure expenditures and the use of leisure time, and
- A nascent trend that appears to be impacting many Americans' value equation for visiting location-based leisure venues.
For some of our readers, this article may seem rather academic, as we have included considerable data and charts. We have provided these to substantiate the current and future trends we have uncovered.
Away-from-home-entertainment and food-away-from-home spending
First, for the spending. We went back to pre-9/11, using 2000 as the base year to analyze Americans' spending for:
- Location-based entertainment in the category of paid entertainment fees and admissions, including spending location-based entertainment venues; we will call this away-from-home-entertainment spending, and
- Food-away-from-home, which includes restaurant and eatertainment dining
The following two graphs show the changes in annual expenditures for both these categories from 2000 to 2006 for all households, as well as four primary categories of families with children:
- Married couples with children younger than 6
- Married couples with children, the oldest child between 6 and 17
- Married couples with children, the oldest child 18 or older
- Single parents with one or more children under 18
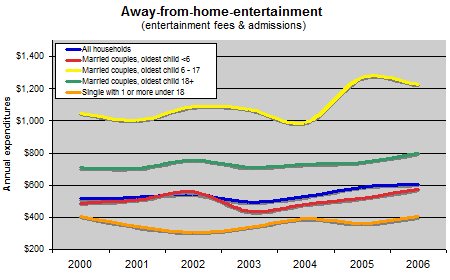
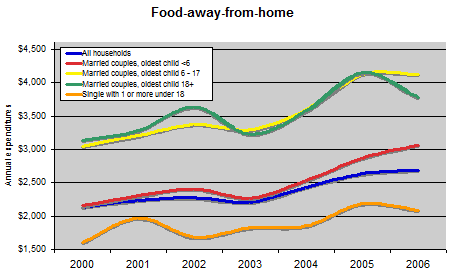
Spending has increased for all households and for all categories of families for both types of expenditures. The exception is away-from-home-entertainment for single parents, which has shown no change. What is interesting is that married couples with the oldest child between 6 and 17 are the highest spenders for both away-from-home-entertainment and food-away-from-home.
However, these graphs don't tell the whole story. While they show dollar expenditures over all seven years, the graphs do not take into account the 17% inflation that has occurred. When we look at the growth of spending adjusted for inflation, we find that away-from-home-entertainment spending has basically remained constant for all households, increasing only 0.5% from 2000 to 2006. For married couples with the oldest child over 18, spending has declined, and for single parent families, spending has declined significantly. Spending for food-away-from-home has increased for all four family types, but much less so for families with an oldest child over 18.
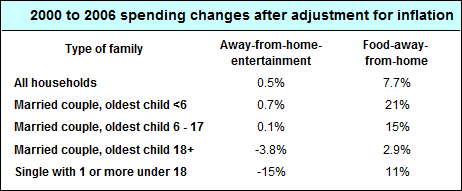
We also looked at the changes from 2000 to 2006 for away-from-home-entertainment and food-away-from-home spending adjusted for inflation for households by quintiles of income (quintiles break a category into five equal parts, each representing 20% of the category count).
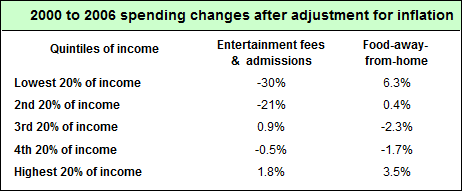
The lowest 40% of all households by income saw a significant decrease in spending for away-from-home-entertainment. For the top 60% of households by income, away-from-home-entertainment spending has basically remained flat. Only the lowest and the highest quintiles saw any significant increases in their spending for food-away-from-home.

In addition to analyzing annual spending, we examined changes between 2000 and 2006 to the share of expenditures by all households that different types of families spent on away-from-home-entertainment and food-away-from-home.
The overall share of away-from-home-entertainment expenditures by all households spent by families with children has decreased by 4 percentage points, or 8 percent over the five years. Meanwhile, spending shares by families with children for food-away-from-home decreased by 0.4 percentage points, only a one percent reduction. Nevertheless, families with children still control 44% of spending on away-from-home-entertainment and 40% of food-away-from-home.
An analysis by the shares of spending by all households by quintiles of income shows some interesting changes since 2000.

Spending by households with the lowest 40% of incomes for away-from-home-entertainment has significantly deceased. Households with the highest 20% of income have seen some increases in spending for both away-from-home-entertainment and for food-away-from-home.
What is most significant is the shift that has occurred since 2000 in the share of all away-from-home-entertainment spending that the two highest household quintiles of income now account for:
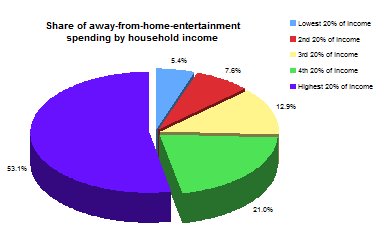
Households with the highest 40% of incomes have increased from accounting for 70.9% in 2000 to 74.1% in 2006, almost three-fourths, of all away-from-home-entertainment spending. The top 20% of income families now account for more than half of all away-from-home-entertainment spending, almost 10 times what the lowest quintile spends and more than four times what the middle or 3rd quintile spends.
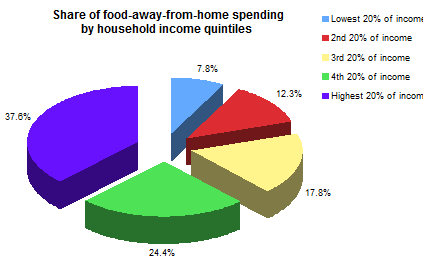
Although not as significantly changed, that same 40% of high-income households now accounts for 62% of all food-away-from-home spending. The top 20% of income families now spend almost five times as much as the lowest 20% spends and more than double what the 3rd quintile of income households spends on food-away-from-home.
Another indicator of possible changes to consumers' spending on away-from-home-entertainment and food-away-from-home is the percentage of their total expenditures on these two categories. This time we also looked at spending on food-at-home and total food spending.
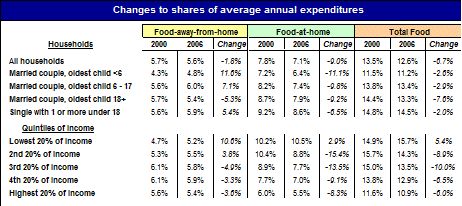
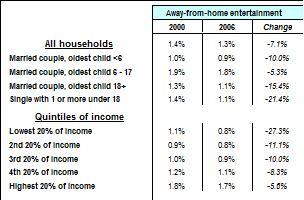
Overall, almost all types of households are spending a smaller percentage of their total expenditures on food, both at home and away from home. However, married couples with the oldest child 17 or younger and single parents have increased their spending share on food-away-from-home, which is counter to the overall trend. It is also notable that households with the lowest 20% of incomes have increased their spending share on food in all categories.
Away-from-home-entertainment has not faired so well since 2000. All types of households and all income brackets have reduced the percentage of their overall expenditures devoted to away-from-home-entertainment, with the largest decreases occurring for single parents, married couples with the oldest children 18 and younger and the lower income quintiles. In fact, the lower the quintile of income, the greater the decrease in the percentage of all expenditures in away-from-home-entertainment spending.
Could it be that consumers are shifting spending from away-from-home-entertainment to other categories of spending? One possibility is that they are shifting their expenditures to television, video and music electronic equipment and services, including televisions; video recorders; cable television; radios; iPods; CDs; and purchases and rentals of DVDs and video games (collectively called electronic equipment and services), or to other entertainment and recreation equipment and services, including outdoor recreation, sports and photography equipment and services (collectively called other entertainment equipment and services). The chart below examines changes in this type of spending.
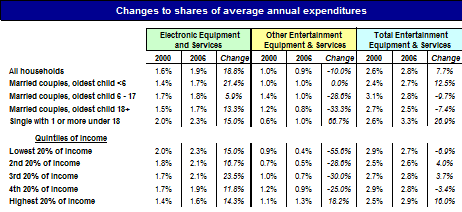
All categories of households have increased their spending percentage on electronic equipment and services. In fact, the increase in spending in each household category for electronic equipment and services is identical to or greater than the amount of reduction to away-from-home-entertainment spending.
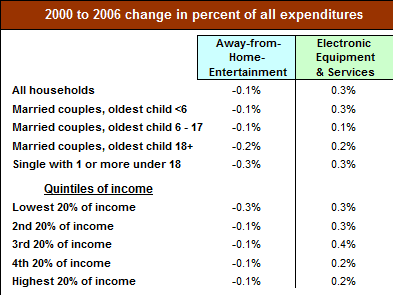
Spending for other entertainment equipment and supplies has seen significant reductions, more so than away-from-home-entertainment for all types of households, with the exception of increases for single parents and the highest 20% of income households, and for married couples with the oldest child 6-17, where it has remained flat.
A factor that may also be contributing to a reduction in the percentage of expenditures that households are making on both away-from-home-entertainment and other entertainment equipment and services is that they are controlling their spending in those categories to save for cost increases in other areas. We hypothesized that two suspects were health care and education spending, which have seen greater than overall inflation cost increases.
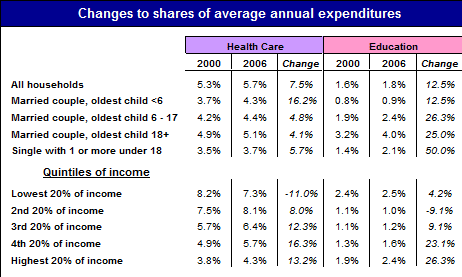
The data proves this out. With the exception of the lowest quintiles of income, all types of households have increased their percentage of spending on health care. For education, families with older children have increased their spending the greatest, as have higher income households. This could be attributable to the cost of putting their children through both private schools as well as college.
We have also examined changes in spending between 2000 and 2006 for all types of entertainment for each household category, as well as what percent of that overall entertainment spending away-from-home-entertainment represents. In addition to the categories of entertainment expenditures examined earlier, all entertainment in the chart below now also includes spending for pets, pet supplies and services, toys, hobbies and playground equipment.
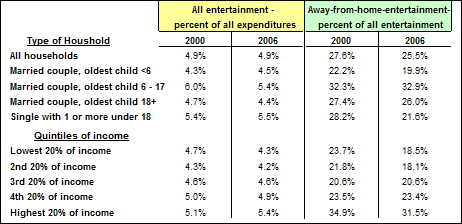
The percentage of total expenditures made on entertainment by different types of households has basically remained constant since 2000. However, the portion of all entertainment spending devoted to away-from-home-entertainment has decreased for all types of households, with the exception of married couples with the oldest child between 6 and 17, where there has been a slight increase, and for the middle quintile of income households, where it has remained constant.
So this leads us to one last examination: When we look at inflation-adjusted figures for all expenditures and for all entertainment spending, what changes have occurred between 2000 and 2006?
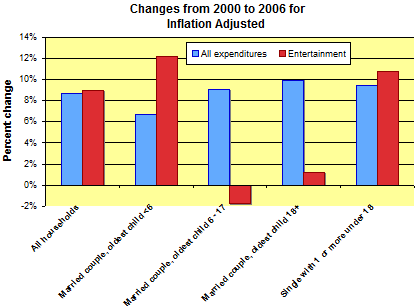
Total expenditures after adjusting for inflation have increased for all households, married couples with children and single parents. All entertainment expenditures have likewise increased in inflation-adjusted dollars for all households, with the exception of married couples with the oldest child between 6 and 17.
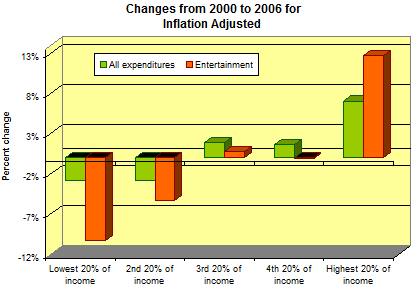
When we examine all expenditures and all entertainment expenditures by quintiles of income, we find that households with the lowest 40% of incomes have lost ground in both categories of expenditures, and the 3rd and 4th highest quintiles have basically remained flat. It is the highest 20% of income households that account for growth for all expenditures, as well as all entertainment spending.
So the bottom line for food-away-from-home spending is that it is increasing faster than inflation. Meanwhile, spending on away-from-home-entertainment has remained basically flat, with the largest increase in both categories coming from households in the highest 20% of incomes. The top 40% of all households now control a larger share of food-away-from-home spending than in 2000 -- 62% -- and they control three-quarters of away-from-home-entertainment spending. Households with children now control 44% of all away-from-home-entertainment and 40% of food-away-from-home spending.
Since 2000, households have shifted a greater percentage of their entertainment spending to electronic equipment and services, at the expense of away-from-home-entertainment and other entertainment and recreation. Increases to education and medical expenditures also appear to be placing constraints on entertainment spending.
Leisure Time
Next we'll examine changes that have occurred with how much time people spend on leisure activities. Two economists, Mark Aquiar at the Federal Reserve Bank of Boston and Erik Hurst at the University of Chicago's Graduate School of Business, recently looked at how non-retired and non-student American adults between the ages of 21 and 65 spend their leisure time, and how it has changed from 1965 to 2003. Published last year in The Quarterly Journal of Economics, their study found that although the number of hours that Americans are working (market work) has increased over the 38-year time period, the number of hours they have available for leisure has increased by six hours a week for men and four hours a week for women. They found that any increase in working hours for women was more than offset by time-saving conveniences for things like cleaning and cooking (non-market work), whether it was microwaves, dishwashers, vacuum cleaners, takeout food, pizza delivery or other innovations. For men, their number of working hours decreased, but was partly offset by the increased time they are spending for housekeeping and other chores.

In 2007, Aquiar and Hurst did a follow-up study of adults aged 21 through 64 who were neither students nor retirees for the American Enterprise Institute to examine what they term the "leisure gap based on educational attainment. They examined changes to leisure time use since 1985. What they found was that in 1985, average time spent in leisure was roughly comparable for men at different levels of schooling, whereas since 1985, there has been a socioeconomic split in the changes to free time. Men with more education have experienced a decrease in leisure time, but the amount of free time has grown for men with less education. The gap in leisure time between men with less than a high school education and men with a college degree grew by 14 hours. For women, those in 1985 who had less education than a high school degree had roughly eight more hours of free time than did college graduates. Since 1985, all educational levels of women have experienced a decrease in leisure time, mainly attributable to increases in the percentage of women working away from home. However, just like men, women with more education lost more leisure time, but the disparity increased by only three hours.
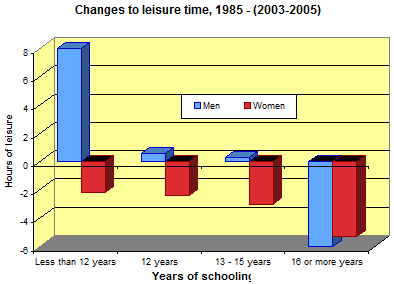
We delved into data from the annual American Time Use Survey (ATUS) to see if we could glean any leisure time trends that have occurred since 2003. The ATUS polls more than 10,000 people each year to determine their time use during one day of the year.
The data shows numerous trends, several of which are a continuation of the trends found in Aquiar and Hurst's research. When we look at averages for all days of the week, men have gained 4 minutes of leisure time between 2003 and 2006, whereas women have lost 7 minutes. However, if the time is broken down between weekdays and weekends and holidays, both men and women have about 10 fewer minutes of leisure time on a typical weekday, but have more leisure time on weekends and holidays; with an average of 7 minutes more for men and 5 minutes more for women.
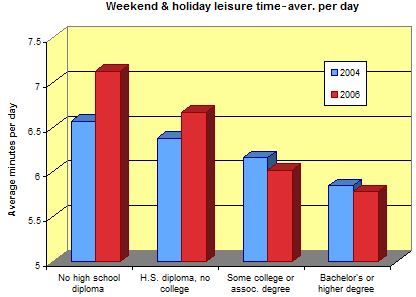
On weekends and holidays, the socioeconomic disparity is widening. People with less education gained the most leisure time, and the most educated lost leisure time. The following graph shows the disparity in 2006 of leisure time, based on education levels.
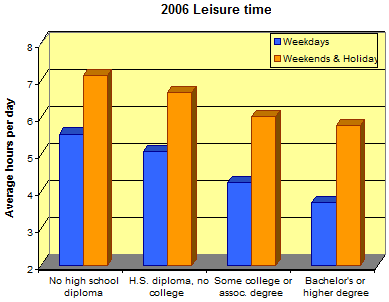
In 2006, non-high school graduates enjoyed almost two more hours (111 minutes) of leisure time on weekdays and 81 minutes more on weekends than did college graduates.
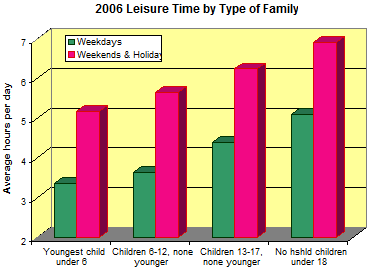
As children grow older, parents enjoy more leisure time on both weekdays and on weekends and holidays.
Time-Pressed Americans
Some commentators call it time poverty, but whatever you call it, across all income levels and household types, most Americans consider themselves time poor. They don't have enough time to do everything they would like to.
Economists Daniel Hamermesh at the University of Texas at Austin and Jungmin Lee at the University of Arkansas at Fayetteville conducted research into the time crunch for Australia, Germany, Korea and the U.S. for couples with at least one worker. They found the following results for Americans in 2003:
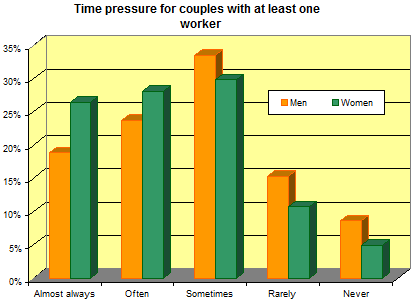
Interestingly, the results for the other three countries were similar. Korea had the highest percentage of almost always or often rushed men and women. Germans felt the least rushed.
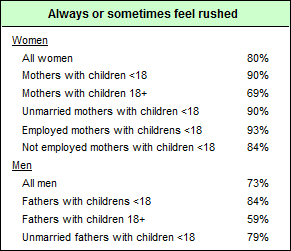
In 2005, The Pew Research Center conducted interviews with over 3,000 Americans and found that 23% of all adults always feel rushed, 53% sometimes feel rushed and only 23% almost never feel rushed.
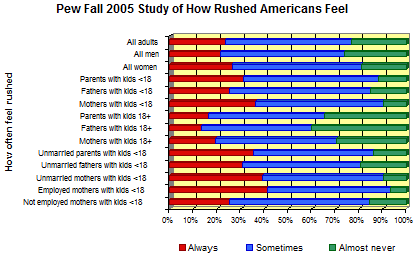
The proportion of parents with children feeling rushed or almost always feeling rushed was significantly higher, especially for mothers with children under 18. Even unemployed mothers with children under 18 feel rushed.
A 2006 survey by the Henry J. Kaiser Family Foundation found that 63% of all adults feel that "having enough free time to do things you want to do is very important to them.
Conclusion
So what does all this time use and time stressed data and analysis really show about expenditures for away-from-home-entertainment and food-away-from-home? What it basically shows is that:
- Households with the highest incomes have the least leisure time, yet the most money to spend. Since 2000, for the top 20% of households by income, as their leisure time has been decreasing, their inflation-adjusted spending on away-from-home entertainment has increased, even though they have less time to spend it.
- Married couples with the oldest child under 18 have held constant on their inflation-adjusted away-from-home-entertainment spending.
- Single parent households and married couples with a child over 18 years have decreased their away-from-home-entertainment spending.
In many ways, the away-from-home leisure market has split off into two have and have-not groups:
- Upscale, higher educated, higher income households with children that have disposable income, but not much leisure time, and who feel the most time pressured
- Lower income and less educated households with children who have the discretionary time, but few discretionary dollars
When it comes to food-away-from-home:
- All family types with children have increased their inflation-adjusted spending since 2000
- Married couples and single parents with the oldest child under 18, which are the most time-pressed of all households, show the greatest increases in their food-away-from-home spending – probably due to the time-saving convenience of purchasing food at restaurants and convenience stores
And just as with away-from-home-entertainment spending, it's the upscale households that spend the most on food-away-from-home.
An across the board trend for all types of families and all quintiles of spending is that inflation-adjusted spending on all types of entertainment has been increasing. However, the percentage of those expenditures going to away-from-home-entertainment is decreasing, as is the percentage spent on outdoor recreation equipment and services and on sports and photography equipment and services. There appears to be an underlying trend to shift entertainment spending from away-from-home leisure and direct those dollars toward in-home leisure and entertainment by purchasing electronic equipment and CDs and purchasing or renting DVDs. Some of the electronic equipment and services spending is also going to what we call walk-around-entertainment (iPods, other MP3 devices and cell phones) and drive-around-entertainment (automotive music and video). Luckily for away-from-home-entertainment, all entertainment expenditures are increasing for all types of households, so the decrease in the percentage of those total expenditures devoted to away-from-home-entertainment is not resulting in significant decreases to inflation-adjusted dollar expenditures, especially for married couples with the oldest child under 18.
The not such good new is that across every type and income level of household, spending on health care and education is consuming an increasing proportion of total expenditures.
In the next issue of our Leisure eNewsletter, we'll examine recent developments that are likely to impact leisure spending, and then attempt to peer into the future to see how all this could impact the future of location-based leisure venues.


