Vol. VII, No. 6, November-December 2007
- Editor's corner
- The changing nature of leisure time
- Who has time to wait?
- Online karting arrives
- Foundations Entertainment University registration is open
- Road kill stew
- Review of IAAPA show in Orlando, Florida
- Grandparent spending
- Free white papers for e-mail marketing
- Death to the black box, hello daylight
- Hurray for pizza
- The relationship of education to income
- Get real, this is a place for children?
- Update on uWink
Who has time to wait?
Time is the new currency, which is why the wait times your customers experience can have a major impact on whether you ever see them again. Did you know that Missouri offers some of the speediest service in the U.S.? Discover which industries and states provide minimal wait times, and where you can expect to cool your heels awhile.
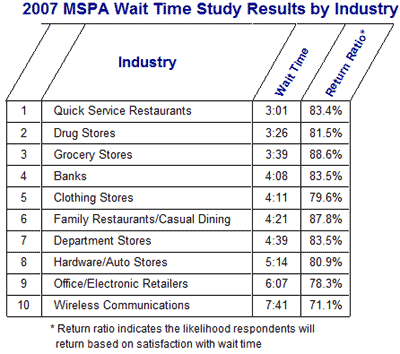
With time being the new currency (see above article), how long consumers have to wait to be waited on has a direct impact on customer satisfaction. Earlier this year, the Mystery Shopping Providers Association (MSPA) completed a study based on more than 10,000 responses from mystery shoppers in 25 cities over a three-month period. The study measured the average amount of time people spent waiting in line among 25 cities and 10 industries in the United States. In addition to wait times, the study also measured Return Ratios, or the likelihood respondents would return to the location based only on wait time. "The difference in wait-time rank and return ratio reveals the correlation between shopper expectations versus actual experience, says MSPA Executive Director John Swinburn. A high return ratio represents that consumers are satisfied with the wait time or expected longer waits. A low return ratio represents consumers expected a shorter wait time. In other words, the study looked at the relationship between wait times and customer satisfaction.
Here are some findings from the survey:
- The average wait time nationwide is 4 minutes, 20 seconds (4:20)
- St. Louis is the fastest city in America with an average wait time of 2:09
- Missouri is the fastest state in the U.S. with an average wait time of 2:52
- Quick service restaurants offered the fastest wait times of the 10 industries, with an average wait time of 3:01 and return ratio of 83.3%
- Quiznos leads the quick service restaurant industry with an average wait time of 1 minute, 15 seconds and a 100% return ratio
- Starbucks placed second in the quick service restaurant category with a wait time of 2 minutes, 8 seconds and a return ratio of 91.5%
The average wait time and return ratios for all 10 industries studied were:

Interestingly, the slowest state was South Carolina, with an average wait time of 4 minutes and 12 seconds, 47% longer than the wait time in the fastest state, Missouri. The second slowest state was Mississippi, only one second faster than South Carolina. Yet the return rations for the three states were practically identical, suggesting that people living in the South are willing to wait longer. This is probably attributable to differences in cultural tempo of life or pace of time between the Midwest and the South, as the South traditionally has a slower pace of life. So the Southerners experience the longer wait times as if they were the same as the faster wait times in Missouri.
In our work throughout the world, we see these cultural time differences, which need to be understood to design successful projects. A number of years ago we did work in Badajoz, a town of several hundred thousand in Spain near the border with Portugal. The town was untouched by tourism. McDonald's opened a restaurant there and couldn't understand why, despite their careful calculations, they didn't have enough seats. The answer was simple. Life in Spain, especially that part of Spain, is much slower paced. There is no such thing as a fast meal. People take hours to socialize while they eat. So the residents were coming to McDonald's and staying for an hour or longer. Thus, no 10-minute table turnovers like in the U.S., so there wasn't enough seating. McDonald's finally figured it out and quadrupled the seating.
Vol. VII, No. 6, November-December 2007
- Editor's corner
- The changing nature of leisure time
- Who has time to wait?
- Online karting arrives
- Foundations Entertainment University registration is open
- Road kill stew
- Review of IAAPA show in Orlando, Florida
- Grandparent spending
- Free white papers for e-mail marketing
- Death to the black box, hello daylight
- Hurray for pizza
- The relationship of education to income
- Get real, this is a place for children?
- Update on uWink


