An earlier version of this article was published in the Aug-Sept 2012 issue of our Leisure eNewsletter.
The rise of leisure time inequality

There are two ways to track changes and trends for leisure and entertainment –expenditures of money and expenditures of time. For the past few years in our Leisure eNewsletter and in Randy White’s, our CEO’s blog, we have focused on research and discussion of the growing inequality of dollar expenditures at restaurants and different types of entertainment venues based on household incomes. In summary, what we found is a growing social stratification – higher income households are increasing in those expenditures while lower income households have declining expenditures. Now we will take a look at changes to the time Americans spend at leisure activities, and especially at away-from-home entertainment.
There are two longitudinal time studies that are valuable resources for examining changes in how Americans spend their time:
- The American Heritage Time Use Study (AHTUS) that covers five decades from 1965 to 2007, and
- The American Time Use Survey (ATUS) of how, where, and with whom Americans spend their time. The ATUS has been conducted annually since 2003 by the United States Department of Labor.
First we will look at the findings from some recent research papers that used the AHTUS data.
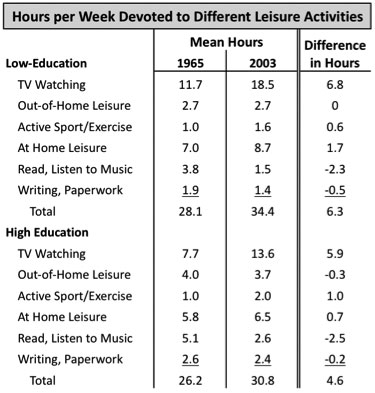
Those papers found that Americans have more leisure time today than they did in 1965, as hard as that is to believe. As of 2003, men had gained 5.26 hours of leisure time per week and women an extra 3.56 hours compared to their counterparts back in 1965.
However, the research found that many of us aren’t having as much fun as we once did with the leisure time we do have.
The researchers examined the quality of leisure time in three ways:
- Pure leisure (the amount of leisure time spent only in leisure activities with no accompanying non-leisure secondary activities, such as taking calls from your boss),
- Social leisure(the amount of leisure time spent with a spouse or other adults but not children who have a way of turning leisure into work), and
- Leisure fragmentation (the number of leisure intervals and their length).
Without getting into a lot of statistics and details, what the researchers found is that between 1965 and 2003, the amount of time adults spend in pure leisure and social leisure decreased for both men and women and the amount of fragmented leisure time increased. The authors of one research paper summarized it this way, "In stark contrast with the changing amount of leisure, most of our quality indicators show declines in the quality of leisure time over this period for both men and women... Despite general increases in leisure time, Americans report feeling increasingly harried now compared with 40 years ago." [1]
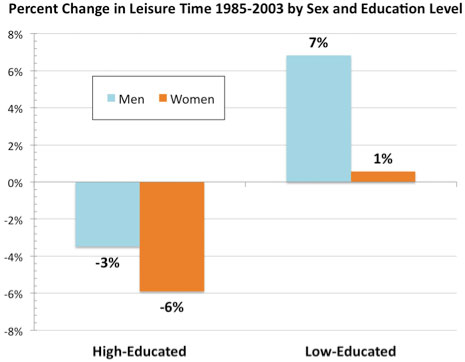
The researchers also found there is an increasing leisure inequality between low-educated (12 or less years of schooling) and high-educated adults (some college or more than 12 years of schooling). The amount of average weekly leisure time between 1985 and 2003 for both high-educated men and women has decreased (by 1.2 and 1.9 hours respectively) while the amount of leisure time for low-educated men and women has increased (by 2.5 and 0.2 hours respectively).
At the same time the researchers found inequality in the quality of leisure time. Quality decreased for the low-educated while it increased for the high-educated. One research paper stated, “Our indicators of the quality of leisure show that the quality of leisure has become lowest for less educated adults. Thus, despite high-educated individuals now enjoying less leisure time than low-educated individuals, high-educated adults are spending more leisure time with their spouse and with other adults [social leisure], have a higher percentage of pure leisure, and have longer spells of leisure [less fragmented leisure] than low-educated individuals. These findings are consistent with a model of quantity and quality of leisure, in which individuals substitute quality for quantity as their wage (education) rises.” [2] Dr. Almudena Sevilla, one of the paper’s authors, speculated that the high-educated people’s higher earning power and work status may enable them to “schedule their leisure time to be less fragmented and to coordinate it with other people’s time off more easily.”
Thus, in summary, the research found that despite high-educated adults enjoying less leisure time than low-educated adults, they are spending more social leisure time with their spouses and other adults, have a higher percentage of pure leisure, and have longer spells of leisure than low-educated adults. In other words, they are having more fun.
We dug into the ATUS data to see if we can discern whether or not the inequality in the amount of leisure time is continuing to increase. The graph that follows examines changes in total leisure time between 2004 and 2011 for persons age 25 and over based on their educational attainment.
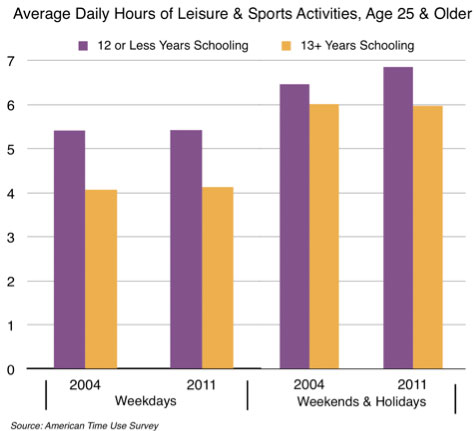
The increasing trend of time inequality seems to have continued since 1985, with low-educated adults gaining more leisure time than high-educated adults. What we find significant is that since 2004, the inequality gap in the amount of weekend and holiday leisure time has grown significantly; the leisure time increased for the low-educated while it has decreased for the high-educated. In 2011, low-educated adults enjoyed 6.85 hours of weekend and holiday leisure time while high-educated adults had 53 minutes less leisure time on a typical weekend or holiday day.
Since education levels are basically synonymous with income, what we are seeing is a bifurcated leisure market, especially when it comes to away-from-home location-based entertainment (LBE) experiences. People who have the most leisure time can least afford to visit LBEs, if at all, while those with the highest incomes, the high-educated, can afford LBE experiences. Since the high-educated feel the most time pressured, they are seeking the highest quality leisure experiences and willing to pay a premium price for them.
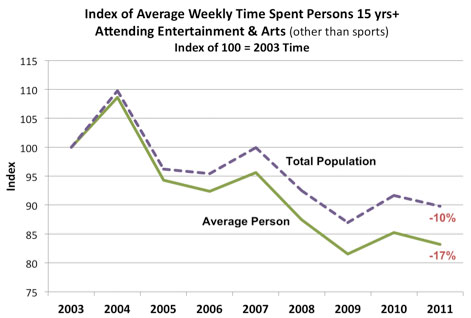
When we dug into the time use data from 2003 to 2011, we found another significant change that appears to be a long-term trend based on other research we have done. The average percent of people age 15 and older attending entertainment and art venues on an average day is on the decline, a decrease of 31% compared to their 2003 participation rate. However, that is partially offset by the fact that the average amount of time spent per day by people who do attend entertainment and art venues has increased by 18% on weekdays and 7% on weekends. The net result is that the average person spent 17% less time in 2011 attending entertainment and arts compared to 2003. For the total American population, the total aggregate hours spent, what you might call the entertainment and art venue time pie, has decreased by 10% (the total American population count increased over the eight years, partially offsetting the individual per person decrease).
This bifurcation of the amount, quality and use of leisure time is consistent with the recent trends we have tracked and reported on:
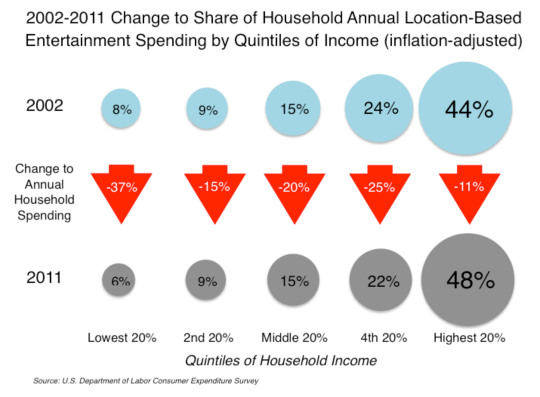
- All households are decreasing their LBE spending, but the highest income households are decreasing their spending less than lower income households. As a result, the highest income households are growing in the percentage of all LBE spending they account for.
- The decreasing participation in LBE activities is mostly attributable to the low-educated, lower income segment of the population.
The time inequality scenario described above also fits well with the high fidelity - high convenience model of entertainment we have written about, with the high income segment of the population, those with the least leisure time and who feel the most time pressured, willing to pay a premium price for high quality (fidelity) out-of-home experiences.

What does all this mean for location-based entertainment? It confirms what we have been commenting on for years. The largest slice of the LBE market pie, in fact the majority of the pie, is consumed by the higher income, high-educated households. And to capture that market, which has the least leisure time, you have to offer a high quality, premium experience.
As the leisure time researchers found, the quality of leisure is partially measured by the social component of leisure. That is why we are redefining out-of-home entertainment as social-tainment, placing the greatest emphasis on creating a high fidelity, quality social experience rather than just thinking of the experience as entertainment and/or food and beverage.
What we need now is research to see if social media time is starting to replace real world social time, as that will have negative implications for LBEs. We speculate that it is, based on some anecdotal evidence we have found.
What all this means is that LBEs have to get even better at attracting, keeping, if not growing, their share of the public’s leisure time.
To learn more about social-tainment, read Randy White’s recent blog, Get unstuck; It’s really all about social-tainment and our Leisure eNewsletter article, Industry terminology is limiting its evolution; Get unstuck!
Additional reading:
- The increasing social stratification of out-of-home entertainment & leisure
- Infographic on entertainment spending on trips
References:
- Sevilla-Sanz, A N G Nadal, J Gershuny “Leisure Inequality in the US: 1965-2003” Demography, August 2012.
- Almudena Sevilla, Jose Ignacio Gimenez-Nadal, Jonathan Gershuny, "Leisure Inequality in the US: 1965-2003", University of Oxford, Department of Economics, Discussion Paper Series