Originally published at Blooloop.com July 2010.
The Increasing Social Stratification of Out-of-Home Entertainment & Leisure
by Randy White, CEO
© 2010 White Hutchinson Leisure & Learning Group
In our previous article, The future of out-of-home entertainment, we examined U.S. trends of both the amount and use of leisure time and expenditures for both electronics and out-of-home entertainment. We found a significant long-term trend of consumers’ leisure time and entertainment expenditures migrating from the real world to the virtual world. In this article, we will share some more of our company’s research findings that help to guide our design and production of our clients’ entertainment and leisure projects. This time we will examine participation and attendance trends at different out-of-home entertainment and leisure destinations. Yes, this all sounds as if it will be a little technical and nerdy, and it is. However, successful development and management of location-based entertainment and leisure businesses requires using what is called evidence-based design founded on research rather than relying on opinions or hunches. The trends we have unearthed are critical to understanding who the best guest prospects are today as well as in the future.
Going to the movies
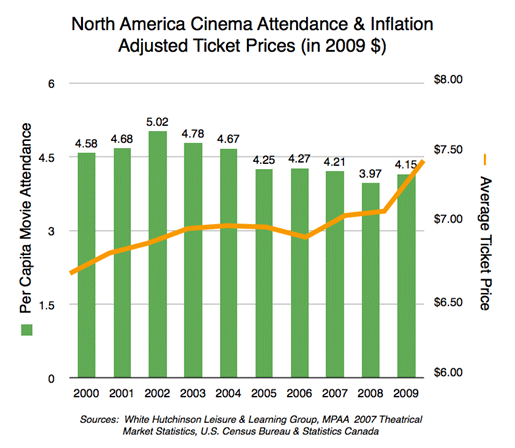
Let’s start with one of the most popular and affordable forms of out-of-home entertainment, movie-going at a cinema:
- In North America, between 2000 and 2009, per capita movie attendance decreased by 9% at the same time the average movie ticket increased by 11%.
- Since peak attendance in 2002, per capita attendance is down by 1/6th.
- The average moviegoer spent slightly more than one-hour less time attending movies in 2009 than they did in 2000.
- Overall the box office increased by 10% to $10.6 billion in 2009, due to both increased ticket prices and a 9% increase in the overall population, not an increase in the population’s per capita attendance.
Examining more closely who goes to the movies is very revealing. In 2009, only 49% of people age two or older in households with incomes of less than $25,000 went to the movies. The percentage participation rate increases as incomes increase, up to 79% of people with incomes of $75,000 or greater. Higher income moviegoers also attended almost twice as frequently as the lower income moviegoers.
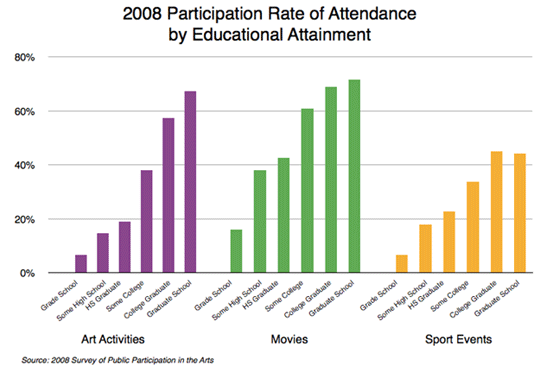
Data on 2008 movie participation shows that education is an even greater determinant of movie going than income. The participation rate for adults with household incomes over $100,000 is about double that for adults with household income between $20,000 and $30,000. When we look at education, however, the participation rate varies by a factor of 4.5 between the populations with only a grade school education versus a college degree, a far greater variation than for income. For example, adults with only a grade school education made up 14.8% of the population, and have a 15.9% participation rate, accounting for 8.5% of all moviegoers, whereas people with a graduate college degree were 9.1% of the population, had a 71.6% participation rate and accounted for 12.3% of moviegoers.

Historically, the movie attendance participation rate for adults has been dropping across all income and education levels. In 1997, 65% of adults went to the movies, in 2002 it dropped to 60% and in 2008, it had decreased to 53%.
Not only is the participation rate of visiting a cinema decreasing, we are also seeing an increase in the social stratification of attendance. In 2002 adults with no greater than a high school education comprised 34.9% moviegoers. In 2008, that had dropped to 31.6%, almost a 10% decrease in participation. During the same period, the percent of adults with some college education or a college degree who attended movies grew from 65.1% to 68.3%, a 5% increase in participation.
Participation rates for other out-of-home activities
When we examine attendance at what are called ‘benchmark art activities’ (jazz, classical music, musical and non-musical plays, ballet and the art museums) and historical parks and sites, and even sporting events, we find a similar pattern. The percentage of adults participating in these out-of-home activities, as well as the average number of events they attended, has been declining more or less continuously since the 1990s. The decline of the participation rate varies between 15% and 28% and the decline of per capita attendance by attendees varies between 9% and 12%. This is even true for overall attendance at sporting events where the overall participation rate has dropped from 37% of adults in the early 1990s to 30.6% in 2008. Again, education is a primary indicator of participation, even for sporting events. For example, in 2008, only 17.8% of adults with a high school education attended a sporting event, whereas 44.5% with a Bachelor’s or higher college degree did. And since the early 1990s, for all activities, overall participation and attendance is shifting to more educated people, i.e., they represent a larger percentage of overall attendance today than in the past. We are seeing an increasing social stratification of attendance in all these out-of-home leisure experiences.
Only in one category, amusement parks, do we find the populations’ overall per capital attendance holding constant (setting aside a minor decrease due to the Great Recession).
Obviously, data for 2008 and 2009 will reflect a possible impact of the Great Recession. However, our analysis of historical data indicates that the decreasing participation rates, decreasing attendee per capita attendance and increasing educational stratification are long-term trends.
It should be remembered that these trends are industry wide. Within any one category or venue, one particular facility could have increasing attendance while others are seeing a decrease.
Migration to the virtual world
Can any of these trends for out-of-home leisure venue attendance be explained by electronic media, or the trend we call the migration from the real world to the virtual world? The data indicates yes.
The Nielson Company reports that an increase in video viewing across all major media platforms continues to be fueled in part by the adoption of technologies that improve the consumer experience both in quality and convenience. They found that the penetration of HDTVs, DVRs, broadband and smartphones increased at double- or even triple-digit rates during the last two years and that time spent watching TV and watching videos on the Internet or mobile phones likewise continues to increase. The iPod, first introduced in 2001, and all its derivations have become the music listening preference for much of the population. Just about everyone is now wired in one form of the other.
Americans love their electronics. A recent survey by Ipsos Loyalty found that Americans love their game consoles more than their cars. Considering Americans’ tradition of a love affair with their cars, that’s really making a statement about love of the virtual world.
Research in the arts finds that U.S. adults, by a ratio of 3 to 2, are more likely to now use electronic and digital media to view or listen to the arts rather than attend a live arts event, with the sole exception of live theatre. And interestingly, there is a strong correlation between electronic/digital participation and live attendance, again with education being the best predictor of electronic participation.
Electronic media probably also explains the decrease in overall sports event participation due to all the ESPN and other sports TV channels and live sporting event subscriptions available on cable. HDTV, home theatre systems and the convenience of NetFlix and even web-based movie services are certainly cutting into attendance at the cinema. It’s hard for historical parks and sites to now compete with the History Channel and other cable TV channels that can dish up history in an entertaining fashion.
“Virtuality, conceived in imagination and birthed in immateriality, enables experiences otherwise impossible in Reality.”
Joe Pine
co-author of The Experience Economy
As noted previously, the one exception to the per capita attendance decline at real world experiences is at amusement parks because they still offer experiences that can’t be replicated in the virtual world. Their thrill level is often off the chart and many, especially the theme parks, incorporate cutting edge electronic technology in attractions, combining the best of both the real and virtual worlds.
Affordability
Our company’s research indicates that the migration to experiences in the virtual world is not the sole cause for these trends. A second major contributor is affordability, which has two different components. The first is the cost of attendance. BIGresearch reported in their June 2010 American Pulse survey that 72% of Americans now consider watching movies at the cinema as too expensive. Just like movie theaters, where ticket price increases have exceeded inflation, the same is true for many other out-of-home leisure destinations, including most sporting events (average theme park ticket prices, adjusted for inflation, have held constant). This makes attendance especially less affordable for middle and lower income groups, contributing to their decreasing participation rates. There is a strong correlation between income and educational attainment, explaining the increased educational stratification of attendance.
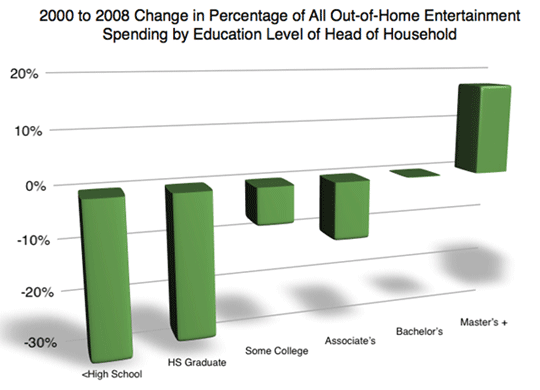
The second component of affordability is the shrinking middle class in the U.S., a trend that started a generation ago and has been accelerated by the Great Recession. The rich are getting richer and the poor are getting poorer. As a result, more highly educated and higher income consumers are accounting for a larger percentage of out-of-home leisure spending. In 2008, households with the highest 20% of incomes accounted for more than one-half (54.6%) of all out-of-home entertainment spending and the top 40% of households by income accounted for more than three-quarters (75.4%) of all such spending, an absolute increase of 4.5% from 2000. Looking at out-of-home entertainment spending from an educational attainment perspective found college graduate headed households increasing from 53% to 56.6% of such spending.
Strategies
Okay, enough of this nerdy stuff. What does all this mean for out-of-home leisure venues? Basically what these trends boil down to is that bricks and mortar entertainment and leisure attractions are losing market share to the electronic virtual world and higher socio-economic households are accounting for an increasing share of both real world attendance and spending.
So what strategies do venues need to adopt to prosper based on these trends? Here’s a capsule summary of some of the proactive strategies our company is using for our clients’ projects:
- Venues need to be designed and operated to meet the high expectations of higher socio-economic households. This includes not only a higher level and quality of architecture, finishes, landscaping and attractions, but also the quality and healthfulness of food and beverage offerings and a high standard of customer service. This is an area where many family entertainment center type venues fail.
- Higher educated consumers tend to have different values than less educated ones. Higher educated consumers have become citizen consumers; concerned about the environmental, ethical, moral and societal values of the companies they do business with. Their spending is influenced by the needs of family, community, society as a whole and the environment. Research in many consumer industries, as well the location-based attractions industry, shows that good citizen businesses attract more business and can command higher prices. Leisure venues need to align themselves with these values.
- The new grounded consumer born of the Great Recession is much more demanding about what value means to them. They are looking for ways to enrich their and their families’ lives in ways that make them smarter, better off and healthier. They require greater value for their money and time than in the past. The recent success of the movie Avatar in its 3D version and many subsequent 3D movies, all at a premium ticket price, speaks to the importance of increasing the value of the experience compared to the past and electronic competition, in this case, 2D movies at the cinema and large screen high definition televisions in the home showing Blu-ray movies. Virtual experiences have raised the bar for all experiences.
- The modern consumer is very digital savvy. Attractions need to integrate cutting edge electronic/digital virtuality into their experiences to stay relevant. They also need to extend their experiences into the virtual world, so some aspects of their experiences can be enjoyed 24/7, whether from the home or on mobile electronics. The use of social media alone is no longer sufficient.
- Consumers want to co-create their experiences, to personalize them. They can co-create virtual worlds and even themselves as avatars. Nike lets customers build and purchase their own personalized shoes on its website. Real world leisure experiences need to offer the same opportunities.
- Venues need to offer experiences that can’t be matched in the virtual world. No Wii or gaming experience can ever match the adrenaline rush of a roller coaster ride. The immersive interactive experience of a go-kart ride can’t be matched in the virtual world. The pleasure and taste sensations of food and beverage cannot be experienced in the virtual world.
- An educated consumer seeks education and learning in their leisure time. What used to be mindless entertainment needs to become enriching entertainment, or what is called edutainment. As entertaining as Avatar the movie was, it also had a strong underlying environmental message. Look at the popularity of all the ‘educational’ TV cable channels such as the History, Discovery, Science and National Geographic channels.
It‘s a whole new world out there, especially the new competitive virtual world. Understanding who to target as your guest and what is your real competition is the key to attractions prospering in the future.
Randy White is CEO of the White Hutchinson Leisure & Learning Group, an international firm that specializes in production, design and consulting for family and children's leisure & entertainment venues. Randy can be reached via the company's website www.whitehutchinson.com or at +1.816.931-1040, ext 100.