
Vol. XXV, No. 10, September 2025
- Editor's corner
- The latest scoop on alcoholic consumption
- Participation in out-of-home activities
- Managing key performance indicators for profitable food and beverage
- Americans' evolving nightlife culture
- How real is virtual? Comparing the experience of a theme park dark ride with its VR counterpart
- Most popular alcoholic beverages
Managing key performance indicators for profitable food and beverage
Food and beverage sales are essential for offering visitors at location-based entertainment venues (LBE) and family entertainment centers (FEC) an enjoyable and memorable experience that they'll want to repeat. At many LBEs, food & beverage sales are the majority of revenues. An LBE with a well-crafted and executed food and beverage (F&B) program increases its market appeal and increases F&B and other revenues by extending the guests' length-of-stay. F&B can drive visits - come for the food and stay for the fun. As crucial as F&B is to the visitor experience equation, profitability is just as important.
Successful F&B operations require monitoring key performance indicators (KPIs), which help businesses benchmark their financial and operational performance for continuous improvement and growth.
One F&B KPI that should be monitored daily is 'per capita F&B sales.' This provides more meaningful data than simply monitoring gross F&B revenues. Gross sales will vary with attendance. They don't tell you whether you are achieving your desired F&B sales per guest. The goal is to identify any issues that may be hindering per capita F&B sales and to address them.
Another F&B KPI is 'prime cost.' F&B sales can add $5 or more in profit for every guest with adequately managed prime costs.
Prime cost is the total cost of goods sold - food, beverage, and related paper products such as disposable cups, napkins, condiments, etc. (COGS), plus the gross labor cost for all F&B employees as a percent of F&B sales. Labor costs include payroll, taxes, workers' comp, medical insurance, and other employee benefits. In the restaurant industry, the prime cost benchmark is 60%, typically 30% for labor and 30% for COGS. Although the labor and COGS percentages may vary, they should not exceed a total of 60%.
It is essential to track prime costs regularly, the two controllable costs - labor and cost of goods sold. However, we often find that LBE and FEC operators:
- Don't track labor costs separately for F&B; instead, they lump all labor together for their entire facility.
- Track labor as a percentage of F&B sales only monthly or less frequently.
- F&B COGS are rarely tracked except on an annual basis.
The problem with infrequent tracking of prime cost is that considerable time, perhaps the entire year, can pass before the operator recognizes that costs may have exceeded the benchmark. There's no way to go back and correct costs at that point, so it represents a permanently lost profit opportunity. For example, the costs of some raw products may have increased, driving up food costs. If you wait a long time to find out, you've lost the opportunity to adjust menu prices or find cheaper substitutes. Perhaps some new employees haven't been adequately trained and aren't following proper portion control. Maybe the staff is being inefficiently scheduled. Waiting a month or longer to determine that labor costs are 40% instead of 30% means your costs have been higher than necessary. Or perhaps an employee has been stealing food products from your walk-in regularly or giving food away free to friends visiting the farm (yes, this happens much more frequently than most operators imagine). Waiting months to calculate COGS to learn things are out of kilter can mean you let thousands of dollars of F&B walk out the back door (literally) or not get paid for.
Regarding labor costs, we recommend calculating the percentage of food and beverage (F&B) revenue on a daily basis. Yes, that's right, daily! It's not difficult to set up your accounting system to do this. Each morning, the F&B manager gets a report on the labor percentage for the previous day. That allows the F&B manager to learn how to improve through immediate feedback. If you wait weeks or months to provide them with this information, they will have forgotten what they did on those particular days regarding the scheduling that resulted in the high labor costs. If they get a report the next morning, they can reflect on the previous day and perhaps learn what can be done differently to improve the labor percentage in the future.
The other advantage of daily reporting is that it sends a loud and clear message to your F&B manager that controlling labor costs is essential. The adage, "That which gets measured gets attention," is very true. Labor is your most controllable cost, so it only makes sense to set up a reporting system that helps your managers stay focused on controlling it.
Calculating the COGS part of prime cost also needs to be done frequently. Most chain restaurants do it weekly. At a minimum, it should be done every two weeks. Weekly or bi-weekly cost reporting will change the attitudes and behavior of your kitchen staff, as it creates awareness of the importance of controlling food and beverage costs. It also lets employees know they are being held accountable. If there is a problem, you will learn about it quickly and can respond accordingly. Regular food costing will easily result in a three-percentage-point or greater reduction in COGS. Again, that which gets measured gets attention.
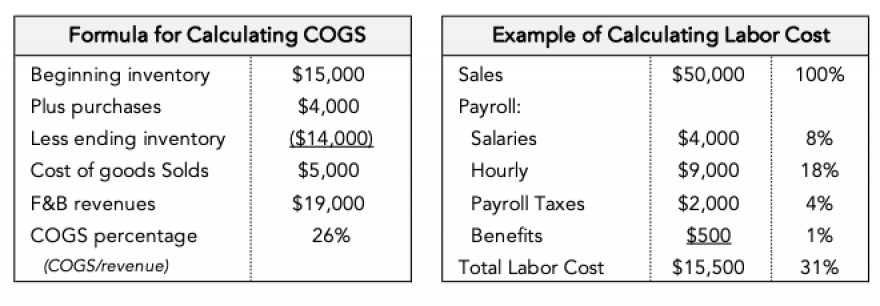
Calculating COGS requires a physical inventory of all food and beverage (F&B) supplies on hand and a calculation of their costs. This takes some time, but with a well-organized stockroom and by setting up simple inventory worksheets, a physical inventory can quickly be done in an hour or so. Conducting regular physical inventories also requires the discipline of setting a fixed scheduled time for it every week or every other week.
The following charts show examples for calculating overall COGS and labor percentage
When auditing the operations of many of our LBE clients, we often find that their menu prices have not been accurately calculated to achieve the desired profit margins. That is an important KPI to monitor. We frequently find that COGS is running 40%, 50%, or higher due to incorrect pricing of menu items or failure to track menu item COGS and adjust prices when food costs increase.
There appears to be a tendency among many operators, perhaps due to their good nature, to underprice menu items, fearing that a too-high price will hurt sales or that they will be taking an unfair advantage of guests. We often find that clients have priced their menu items below the market for similar quality restaurant offerings, sometimes for even less than McDonald's sells those items. You should never price your menu items below comparable restaurant prices based on the quality of what you are offering. You are not competing with McDonald's, as you have a captive customer. However, you don't want prices to be too high, like those at theme parks, where visitors may feel overcharged. Menu prices that are too low can hurt sales, as guests will be suspicious that the food is low quality based on the price. You can command a premium price over comparable restaurant operations by offering good quality products and with display cooking, such as having an open kitchen where guests can see food being prepared. The public sees it as more of a value equation than an absolute price consideration when purchasing quality prepared foods.
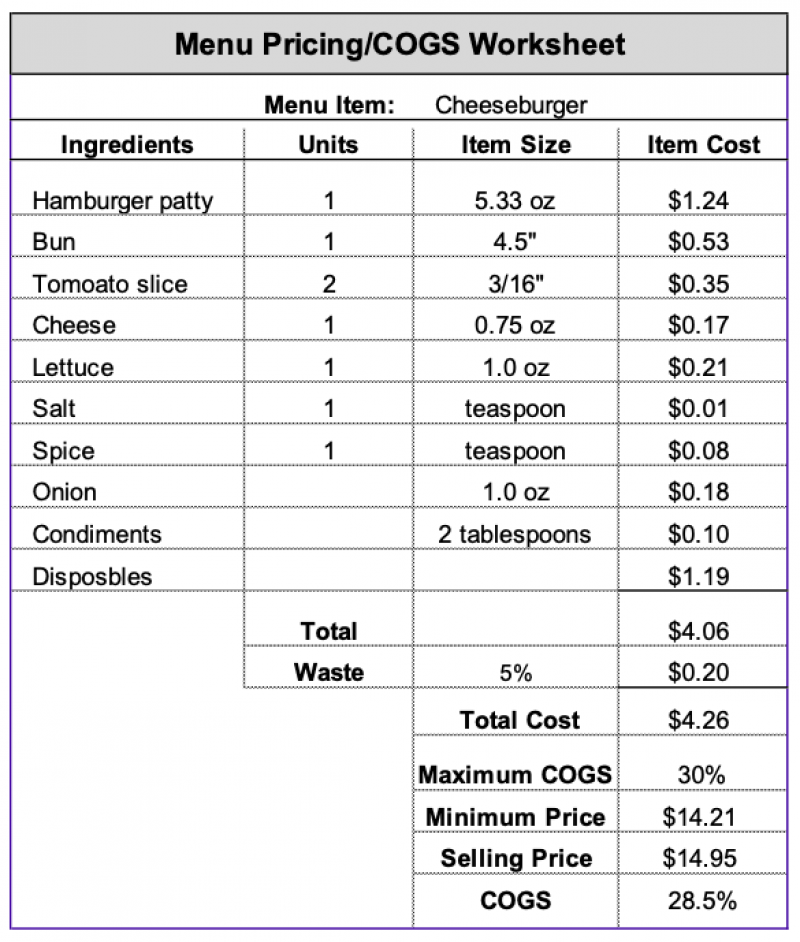
Properly setting menu prices requires a detailed cost analysis of each menu item, ensuring the cost includes every ingredient and disposable paper/plastic item used. For example, the cost analysis for a cheeseburger should consist of the hamburger, cheese, roll, lettuce, tomato, onion, seasoning, condiments, and disposables - such as paper plates and napkins. Then, a factor needs to be added for waste - food that spoils, dropped food that is thrown away, and prepared leftover food that can't be saved at the end of the day. Then, you divide the menu item's total cost by your desired maximum COGS. In the example, you want to maintain a COGS that does not exceed 30%. To calculate the minimum selling price, divide the total cost of $4.26 by 30% to get the target selling price of $14.21. But don't stop there. If cheeseburgers of that quality are selling in the $15 range in your market, consider setting the price higher at $14.95, which yields a 28.5% COGS. Additionally, regardless of comparable selling prices, you should always round the price up to a regular menu price, such as $14.89 or $14.95, which is not perceived as significantly different from $14.21.
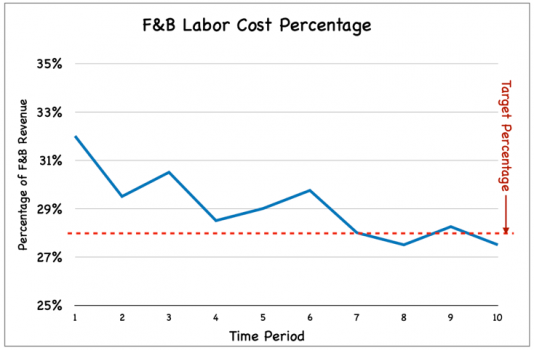
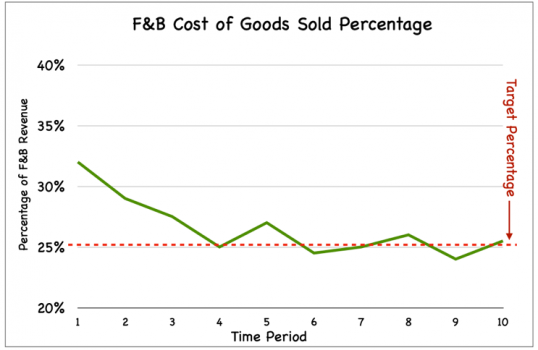
In addition to supplying labor costs and COGS to your F&B manager, taking an open-book approach of sharing this information with all F&B staff dramatically improves performance. We advise our clients to post two graphs where the F&B staff will see them daily. One can show the labor percentage, and the other the weekly or bi-weekly COGS. The vertical y-axis should show the ascending percentage, and the horizontal x-axis should indicate the time periods. The target range should also be shown. Then, each day or week, the new results are posted. This gives the staff immediate feedback. If the percentage is in the target range, that is good. If the graph shows costs increasing, that indicates to employees that things are moving in the wrong direction (an upward trend). If the percentage on the graph goes down, the staff is improving.
The open-book approach conveys to all F&B staff members that controlling prime cost is essential. It provides them with immediate feedback on their performance. Staff members have far more control of COGS than anyone else because they handle portion control. They create waste. They are doing (or not doing) the upselling to more profitable food items. The graphs will help them understand why proper portion control, minimizing waste, and up-selling are essential. It lets the F&B staff know they're regularly evaluated in these performance areas. It also allows them to know their theft will quickly show up in the performance results if they steal. And if their hours need to be cut back, they can better understand why -- that it is necessary from a business profitability standpoint and is not some arbitrary management decision.
Controlling the key performance indicators for prime cost requires procedures and discipline. When done correctly, you will have a continuous stream of profits from your food and beverage sales.
Subscribe to monthly Leisure eNewsletter
Vol. XXV, No. 10, September 2025
- Editor's corner
- The latest scoop on alcoholic consumption
- Participation in out-of-home activities
- Managing key performance indicators for profitable food and beverage
- Americans' evolving nightlife culture
- How real is virtual? Comparing the experience of a theme park dark ride with its VR counterpart
- Most popular alcoholic beverages