
Vol. XV, No. 4, May 2015
- Editor's corner
- Foundations Entertainment University 2.0 adds 12 new topics for July 14-16 Chicago seminar program
- My FEC is feasible since there's nothing in my town for families to do
- Moo Town, USA opens
- The trade show everyone should attend, but few do
- Trends with age of marriage, 1st births, childlessness & family size
- Dairy or no dairy: The various degrees of vegetarianism
- Harnessing the power of FoMO
- Chasing the next BIG Thing
- The next generation of credit card payment technology
- Trends found at the restaurant show
- Latest scoop on alcoholic drinks
Latest scoop on alcoholic drinks
If you every wondered about how alcohol use varies across the country, here's a map that gives you the answer.
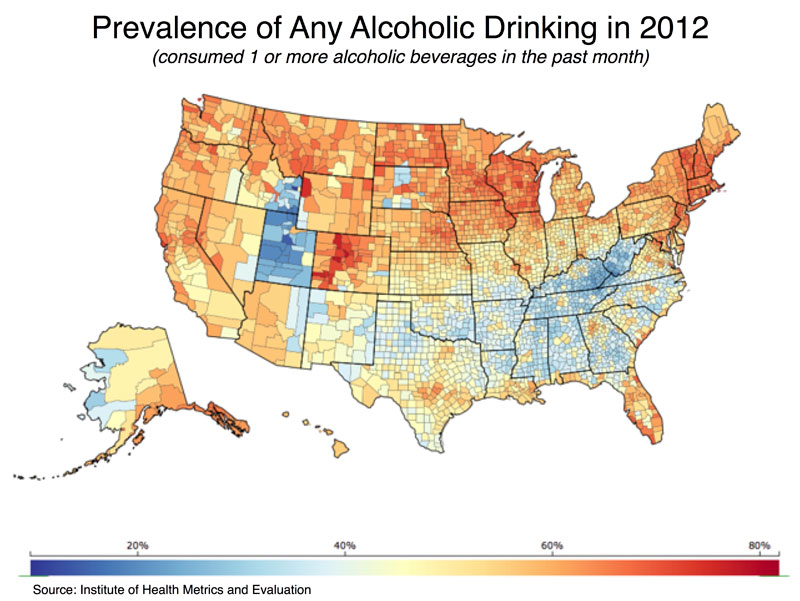
If you'd like to dig into the data in detail to see about drinking prevalence in a particular county, your can find an interactive map here where you can scroll over the country to see the data: http://vizhub.healthdata.org/us-health-map/
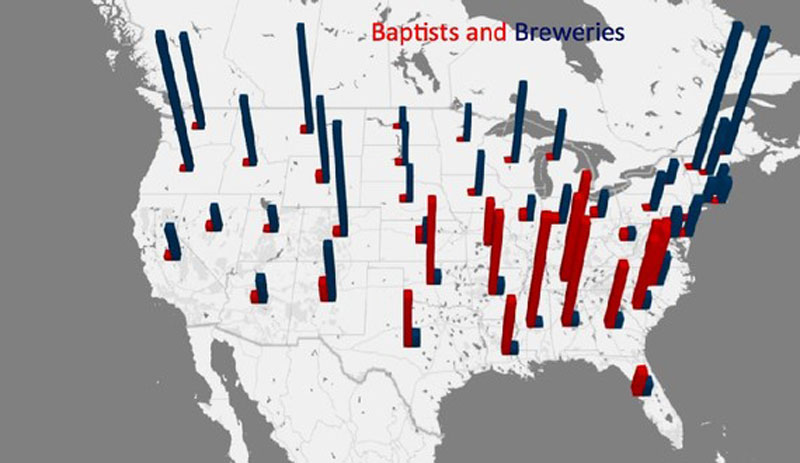
There is much less drinking in the South. Less drinking in the South correlates with less craft breweries located there. The nine states with the fewest breweries per population are in the South. For example, Vermont had one craft brewery for every 25,000 residents in 2012 whereas Mississippi only had one for every 994,500. Steve Gohmann, a professor of economics at the University of Louisville, published a paper Why Are There so Few Breweries in the South that attributes it to a blend of regulation, religion and corporate interests that makes the South less hospitable to small breweries. Here's his map showing the correlation of the number of Baptists (in red) and the number of breweries (in blue) per state that makes the point from a religious perspective.
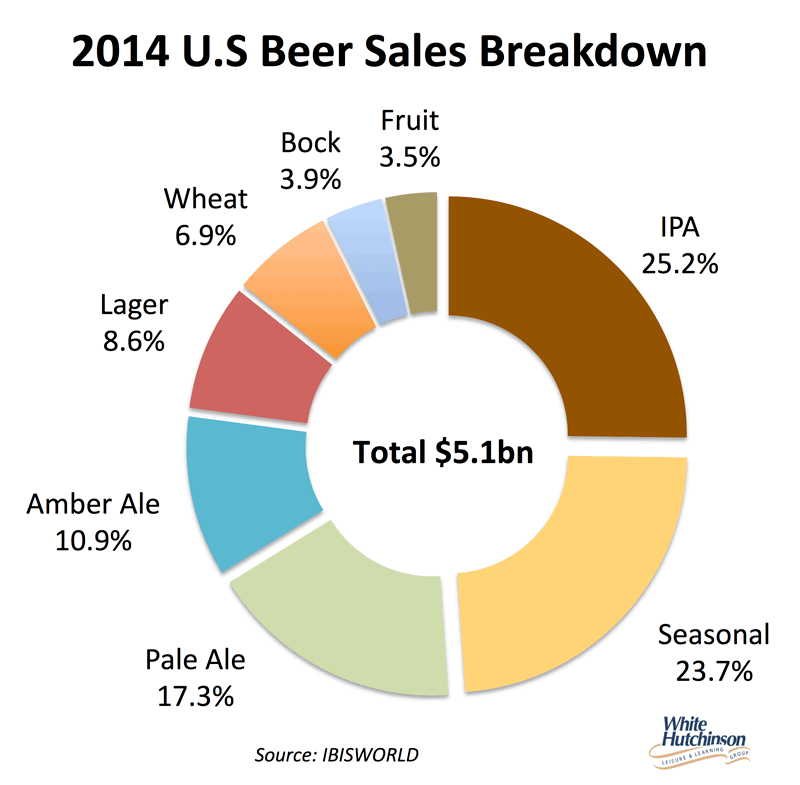
And speaking about beer, here's a breakdown of 2014 beer sales by type of beer.
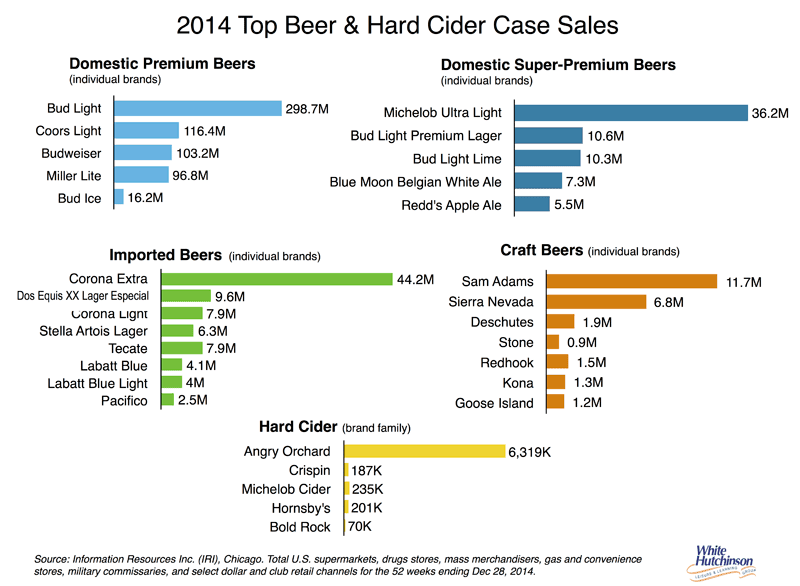
And here's a breakdown of the top selling beers and hard ciders.
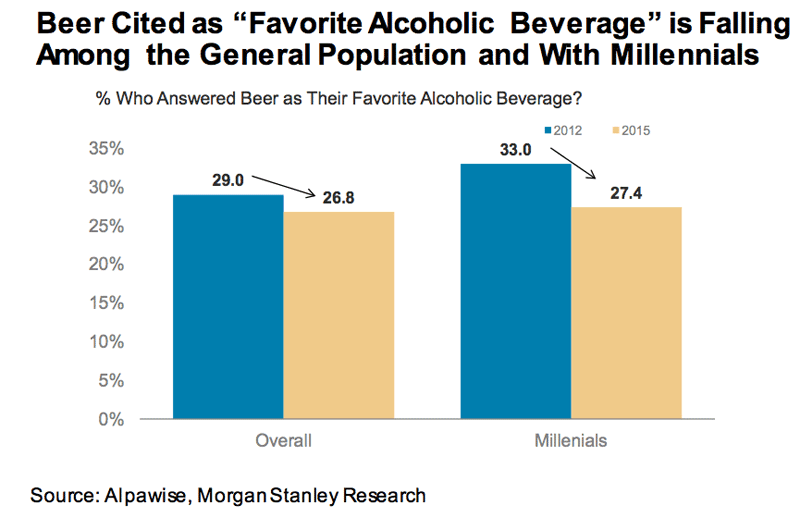
Beer is declining as the preferred drink as Americans switch over to wine and spirits. Here's the latest findings based on an April survey by Morgan Stanley Research.
Vol. XV, No. 4, May 2015
- Editor's corner
- Foundations Entertainment University 2.0 adds 12 new topics for July 14-16 Chicago seminar program
- My FEC is feasible since there's nothing in my town for families to do
- Moo Town, USA opens
- The trade show everyone should attend, but few do
- Trends with age of marriage, 1st births, childlessness & family size
- Dairy or no dairy: The various degrees of vegetarianism
- Harnessing the power of FoMO
- Chasing the next BIG Thing
- The next generation of credit card payment technology
- Trends found at the restaurant show
- Latest scoop on alcoholic drinks