
Vol. XIII, No. 5, June 2013
- Editor's corner
- How digital technology disrupts the perceived value of location-based entertainment
- National Park visits on the decline
- Is Chuck E. Cheese's last decade's performance a harbinger of the future of children's entertainment?
- Free scholarships available to Birthday University
- The importance of food and beverage - Part 2: Snacks
- Foundations Entertainment University - businesses don't plan to fail, they fail to plan SMARTLY
- The three elementary rules for being great
- Aggregate household spending on community-based entertainment
- Here's what 24/7 construction looks like
Is Chuck E. Cheese's last decade's performance a harbinger of the future of children's entertainment?
The family entertainment center (FEC) industry is made up of a variety of different categories of projects and within each category there is wide variation from project to project. So other than analyzing attendance and customer spending on a broad nationwide macro basis, it is difficult, really impossible, to determine any longitudinal trends within any one category of project. But there is one exception, CEC Entertainment, Inc. that owns, operates and franchises Chuck E. Cheese’s eatertainment facilities. The history of CEC dates back over 35 years. They have been a public company for over 30 years, and as a public company, a wealth of information is available about their operations. As of December 31, 2012, CEC owned and operated 514 company-owned stores and had 51 franchised operations (many overseas). The facilities that CEC operates have been rather consistent in size, currently averaging 12,000 square feet, allowing for good longitudinal comparison (this is unlike Dave & Buster’s whose facilities have had a wide range of sizes over the past few years).
The following is our in-depth analysis of CEC’s performance for their last ten fiscal years – 2003 through the close of their 2012 fiscal year (their fiscal years are on a calendar year basis). Our analysis includes a lot of numbers. We have tried to make our analysis as easy to follow and understand as possible by using a lot of graphs to illustrate points.
It’s worth reading and understanding, as it could well be the harbinger of the future of the children’s entertainment center industry and also offer some insights for other types of location-based entertainment centers (LBE), including family entertainment centers (FEC). We will have some comments about that at the very end of this article.
For our analysis, we did two things. First we excluded CEC’s revenues for franchise fees so we were only examining performance of company owned and operated stores (operating data on franchised stores is not publically available). Secondly, we adjusted for the declining value of the dollar by also adjusting for inflation, which was 19.9% over the ten years.
The reason we adjust for inflation is because just using real dollar figures does not tell the true story of performance over any time period. It would take $1,248,000 of revenues, income or EBITDA in 2012 to be equivalent in value to $1,000,000 in 2003. Over the 10 years, revenue, income or EBITDA would have had to increase by 19.9% just to stay even. So many times what will look like an increase in revenue, income or EBITDA is really a decrease when you adjust for inflation.
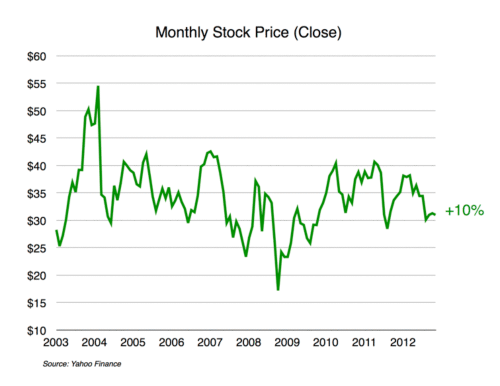
CEC’s stock price was 10% higher on December 31, 2012 then it was on January 31, 2003.
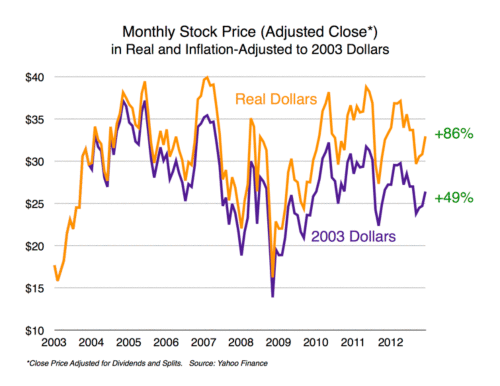
When you add in the value of dividends CEC has paid, the stock’s performance is even better, up 86% in investment value, which is significantly greater than the inflation rate. Even if you adjust for inflation, the stock shows a 49% appreciation in overall value.
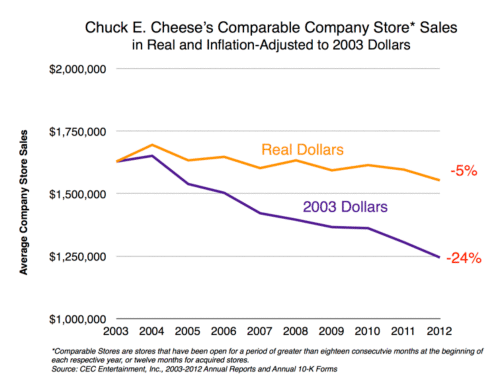
Part of the reason for the stock’s good performance is the growth of total company store sales. They are up 23%, but actually down two percent (-2%) on an inflation-adjusted basis.
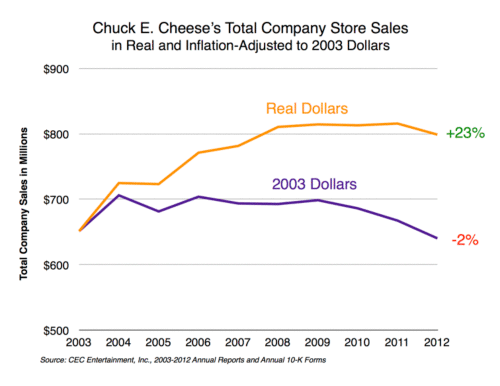
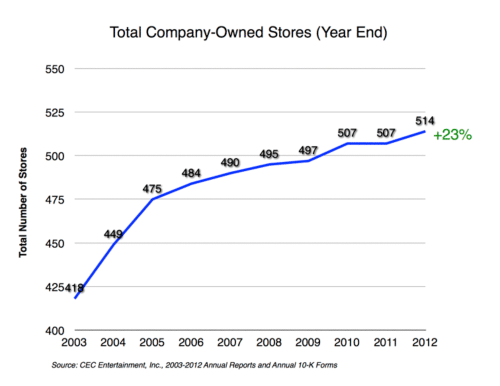
Over the 10 years, the number of company stores has increased by 23%, the same rate that total store sales have increased. So it is the increase in the number of stores that is responsible for total revenue growth in real dollars.
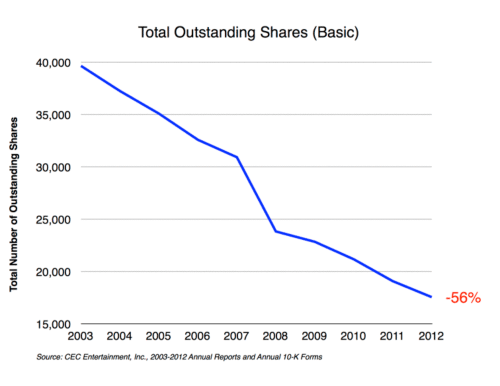
The other reason the stock is probably performing well is that the company is buying back shares of its stock, so the number of outstanding shares has decreased by 56% since 2003, resulting in a multiplier effect on earnings per share.
When we dig into the data further and analyze individual company store sales, the story gets rather ugly.
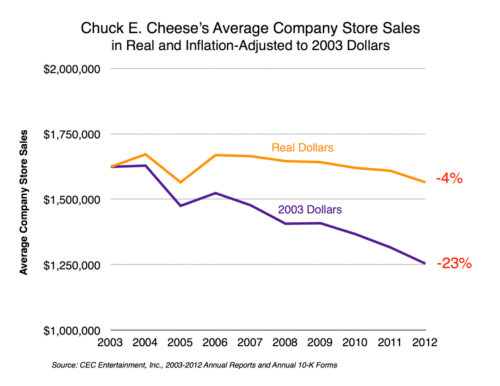
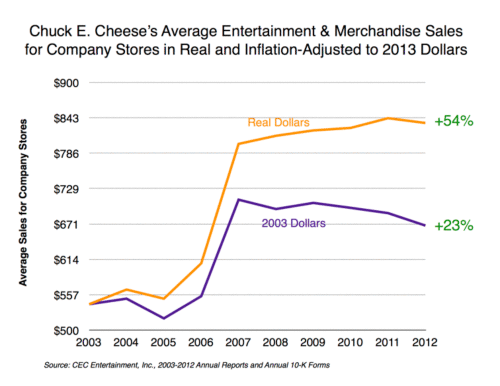
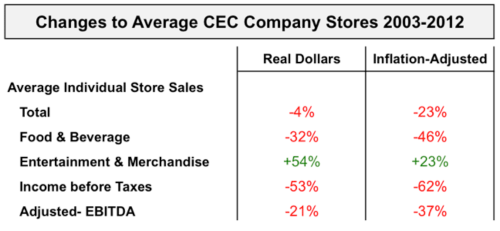
Average sales at company stores have declined by four percent (-4%) between 2003 and 2012 (see footnotes for explanation of average store calculations). When adjusted for inflation they are down 23 percent (-23%). As the graph below shows, this is a long-term trend, not something brought on by the Great Recession, although that is most likely a contributing factor in recent years.
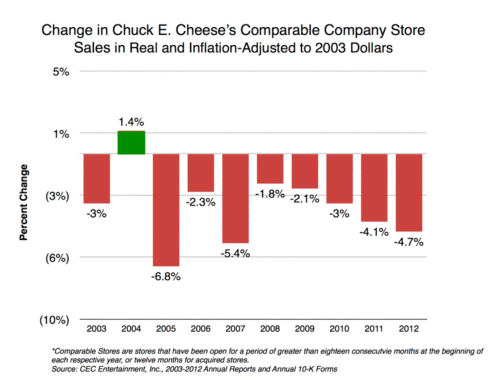
This is what the change to comparable company store sales looks like when adjusted. The only year with a real dollar increase was 2004.
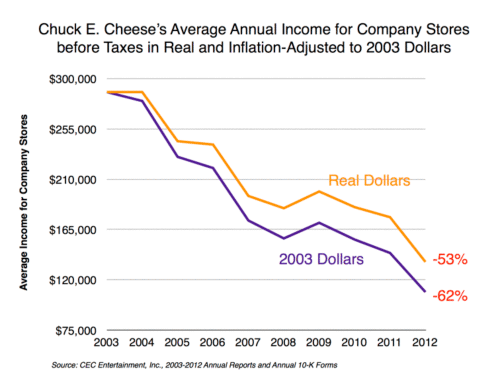
When we looked at the profitability of stores (including allocation of expense at the corporate level which were 6.7% of revenues in 2012), things really look bad. Average annual income before taxes for company owned stores declined by fifty-three percent (-53%) on a real dollar basis and by sixty-two percent (-62%) when adjusted for inflation.
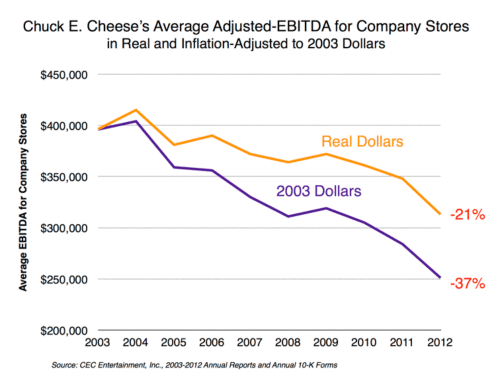
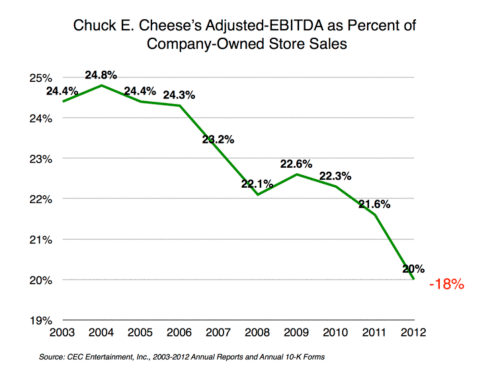
Average adjusted-EBITDA looks better, but it is still negative, down 21% and 37% inflation-adjusted (see footnotes for explanation of adjusted-EBITDA). In 2003, adjusted-EBITDA was 24.4% of sales. It declined to 20.0% in 2012.
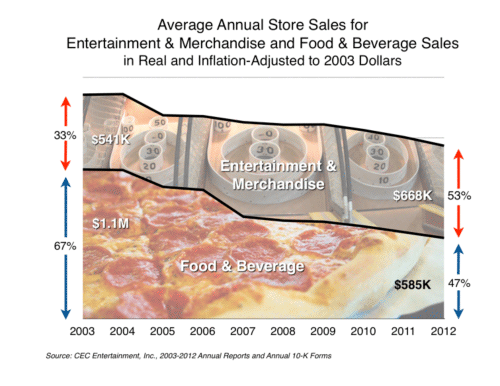
Individual company store sales have changed significantly in the proportion of food & beverage sales compared to entertainment and merchandise sales. Average store F&B sales have declined by thirty-two percent (-32%) and -46% when adjusted for inflation whereas entertainment and merchandise sales have increased by 54% or only 23% when inflation-adjusted, not enough to offset the decline in F&B sales.
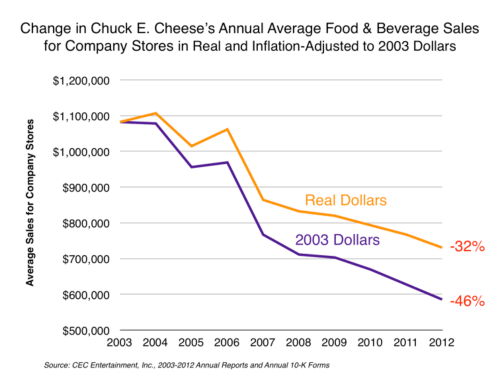
F&B sales have declined from two-thirds (67%) of all sales to less then half (47%) while entertainment and merchandise sales have increased from one-third (33%) to over one-half (53%) of sales. Here’s a graphic representation of the changes from 2003 to 2012 in both real and inflation-adjusted dollars.
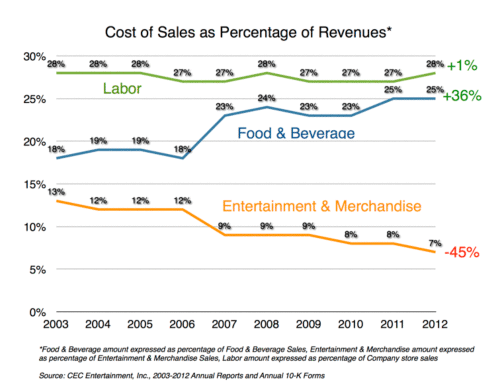
We also looked at changes to labor costs and the cost of goods sold (COGS). Labor costs have remained steady as a percent of sales. The COGS for F&B has rising by over 1/3 (+36%) from 18% to 25% of F&B sales. The COGS for entertainment (basically redemption games) and merchandise has decreased by almost one-half (-47%) from 13% to 7% of such sales.
So, at a corporate level or if you are an owner of CEC Entertainment stock, things have not been great, but not all that bad over the past ten years. But when you drill down to look at individual store performance, things got rather ugly:
What does all this tell us? First, it is important to understand that CEC is a professional, well-managed company. They have a top team of executives at the corporate level. As a large company with over $800 million in revenues and 514 company operated stores, they can mine, analyze and use store level data to fine-tune and improve performance. They have the ability to test and tweak new equipment, programs and marketing at a few stores to assure they have positive results before rolling them out company wide. They can analyze individual store performance compared to its trade area demographics to fine-tune their selection of new store locations. They have enormous buying power with the game, furniture, kitchen equipment, other equipment and food and beverage suppliers they buy from. They have many advantages that individually-owned children’s entertainment centers do not. We do not believe you can attribute the downward individual store performance solely to management. There are also other forces at work.
These are some factors that we believe may be influencing CEC’s declining performance trend (in no particular order):

- CEC is a victim of digital disruption; it has increasing competition from digital entertainment and social media, both in the home as well as on mobile devices. Today, in addition to game consoles, high-definition television and streaming entertainment content, children are now using tablets and smart phones, including all the entertainment options they offer.
- Digital disruption is also contributing to a decreasing value perception of visiting a Chuck E. Cheese’s since digital entertainment is increasing in its Convenience (see this issue’s article How digital technology disrupts the perceived value of location-based entertainment).
- Children are growing up faster—a phenomena called age compression. The age at which children move on from Chuck E. Cheese’s and consider it a sissy thing to do is declining. That is shrinking the size of CEC’s market penetration in their geographic trade areas (a narrower age range of children that they attract).
- There is more children’s entertainment venue competition, especially for birthday parties. At one time Chuck E. Cheese’s was the Birthday Party Capital, as in most markets they were about the only place to hold a child’s birthday. In the past 10 years we have seen the rapid expansion of inflatable bounce house centers, trampoline centers, children’s entertainment centers, play cafes for preschool children and other options for children’s out-of-home entertainment and birthday parties. Farm agritainment venues have expanded in numbers to the point where they now own October as THE family destination.
Back in 2003, CEC’s average store had an attendance of 1,300,000 and held an average of 80 birthday parties a week. Birthday parties were a very substantial part of their business. CEC now reports that birthday parties are only generating 10% to 15% of revenues. Although they no longer report attendance, based on the decline in comparable store sales and increasing prices for things like food over the ten years, it appears obvious that attendance has declined as well as the number of birthday parties they host. - Entertainment and merchandise sales are the shining star when it comes to individual store performance. At least that is what an average 23% inflation-adjusted per store entertainment and merchandise (E&M) sales increase indicates. However, often what you see on the surface is never the entire truth. We dug down into CEC's financial statements and 10-K security filings and found that the average store size has been increasing as:
- CEC has been expanding many stores by 1,000 to 4,000 square feet. This is what CEC says about store expansions and new stores: “We believe store expansions improve the quality of the guests’ experience because the additional square footage allows us to increase the number and variety of games, rides, and other entertainment offerings in the expanded stores. In addition to expanding the square footage of a store, store expansions typically include all components of a major remodel and result in an increase in the store’s seat count.”
- Their new stores are typically larger in size than the average store size at the time. In 2007 their average new store size was 12,500 square feet. In 2010 it had increased to 15,000-16,000 square feet.
Even at that, E&M sales are making a greater contribution to income and adjusted-EBITDA as their COGS has been decreasing.
- While entertainment and merchandise sales were increasing in stores, food and beverage sales were taking a nosedive, responsible for the overall decrease in individual store sales over the ten years. The cost of goods sold for F&B has also been increasing over the years, decreasing the profitability of the F&B they did sell.
For years while the restaurant industry was raising the bar on the quality and healthfulness of food, CEC appears to have fallen behind the curve and as a result saw decreasing food and beverage sales. Where once food was their major draw (or at least had a major synergistic effect when combined with the entertainment), now its appeal has diminished.
This is not surprising based on past surveys of how consumers rated their food. A late 2012 consumer survey by Nation’s Restaurant News and WD Partners gave Chuck E. Cheese’s the lowest rating of over 152 chains and the lowest rating of among 100 limited-service chains for food quality, value, menu variety and craveability. Chuck E. Cheese’s scores for every restaurant attribute that the survey found decreased from the previous survey (see our April 2013 article). That same survey for early 2011 also showed Chuck E. Cheese’s having the lowest rating of all 92-chain restaurants surveyed then.
 To reverse their poor consumer dining designation and food quality ratings and reputation, in 2012 CEC introduced an upgraded pizza with a made-from-scratch crust and real mozzarella cheese shredded in the store. The new pizza has now been rolled out throughout the entire chain. We haven’t had a chance to try their new pizza, but one food reviewer found it much improved (read his review). Chuck E. Cheese’s has also added a gluten-free pizza and gluten-free cupcakes and redesigned the menu boards in all their stores so they are easy-to-read and provide nutritional values.
In April of this year Chuck E. Cheese’s was named the No. 1 kid-friendly restaurant by Technomic's Consumer Restaurants Brand Metrics program, which compiles consumer data about various chains from 80,000 surveys taken throughout a two-year period. We were surprised to see this May that a study by Market Force Information reported that Chuck E. Cheese’s tied in second place with California Pizza Kitchen for food in the individual pizza category survey of 7,000 consumers. Chuck E's was also voted the overall fifth-favorite casual dining pizza chain by consumers in the survey.
It is a little hard to comprehend how Chuck E. Cheese’s consumer food ratings could turn so positive so fast. But nevertheless, they appear to finally be making headway in the food and beverage category.
Take Aways
So what does all this mean for the community-based entertainment and eatertainment industries? Perhaps most of all is that the community-based children’s entertainment venue business has gotten more competitive and tougher to succeed at, at least when we are talking about predominately arcade game-type entertainment.
Secondly, that food and beverage is a very important part of the success formula as it is a significant contributor to profitability. The numbers clearly show that CEC’s per store sales and profitability decline is attributable to their declining F&B sales.
Without F&B sales, CEC stores would currently be operating at a loss (average 2012 store F&B sales of $730,000 minus 25% COGS and 28% labor means a $343,000 contribution to per store income before taxes, which is currently only $136,000 per store).
So if you are in the business of operating a children’s entertainment center, a family entertainment center, a bowling center or any other type of location-based entertainment venue (LBE), don’t lose sight of the importance of food and beverage. You don’t want to fall behind the curve for quality and healthfulness of the food you serve compared to what is happening in the overall restaurant industry, as that is what forms consumers’ expectations for the F&B you offer. And when you fall behind the curve, your sales will decline. Our industry research indicates that not only will you experience a decline in per capita F&B sales, but also a decline in over all attendance, as quality F&B is a significant part of the formula for the attractiveness of any LBE.
Footnotes:
- Data was derived from CEC Entertainment, Inc. annual financial statements and 10-K filings.
- We used the CPI-U, Consumer Price Index for All Urban Consumers
- Full disclosure: Our CEO, Randy White, owns a small amount of CEC stock
- We deducted franchising fees and royalty revenues (0.6% of all CEC revenues) to calculate company owned store performance. We did not deduct the proportion of corporate general and administrative expenses that would be attributable to selling and managing franchises, as such information was not available. We do not believe that a deduction of attributable general and administrative fees would have affected the trends our analysis uncovered nor changed company store income or adjusted-EBITDA by more than 0.5% of sales. In 2012, total general and administrative expenses were 6.7% of total company revenues.
- CEC Entertainment, Inc. defines comparable stores as domestic company-owned stores that have been open for at least 18 months as of the beginning of each respective fiscal year or operated by them for at least 12 months for stores acquired from franchisees.
- EBITDA is earnings before interest, depreciation, depreciation and amortization. We also excluded asset impairment charges, as they are a non-cash, non-operating expense, so it becomes adjusted-EBITDA.
- We calculated income and adjusted-EBITDA at the average company store level by taking total company income (less franchise fees and royalties) and adjusted-EBITDA and dividing it by the average number of company stores in each year.
- Average annual sales per comparable store are calculated based on the average weekly sales of the comparable store base. The amount of average annual sales per comparable store cannot be used to compute year-over-year comparable store sales increases or decreases due to the change in comparable store base.
- CEC reports that they are achieving about a 25% return on investment for their new stores.
Vol. XIII, No. 5, June 2013
- Editor's corner
- How digital technology disrupts the perceived value of location-based entertainment
- National Park visits on the decline
- Is Chuck E. Cheese's last decade's performance a harbinger of the future of children's entertainment?
- Free scholarships available to Birthday University
- The importance of food and beverage - Part 2: Snacks
- Foundations Entertainment University - businesses don't plan to fail, they fail to plan SMARTLY
- The three elementary rules for being great
- Aggregate household spending on community-based entertainment
- Here's what 24/7 construction looks like