
Vol. XII, No. 4, June 2012
- Editor's Corner - International travels
- What a difference 21 years makes with household spending
- New free directory for agritourism businesses
- Sustainability A to Z: Still relevant for both consumers and industry
- Foundations Entertainment University - July 17-19 in Chicago
- The potential of the stay-at-home mother with young child market
- Attracting Generation X
- Theme park attendance is counterintuitive to macro LBE spending trends
What a difference 21 years makes with household spending
Around the year 1990 is when the indoor FEC and children’s entertainment center industry started its major growth. So out of curiosity we decided to take a look at changes in how American households spent their money between 1990 and 2010 using data from the Bureau of Labor Statistics Consumer Expenditure Survey. We adjusted the expenditures for inflation so they were all in 2010 dollars. The results show there have been some significant changes in American household spending over that time frame. We are most interested in changes to household out-of-home entertainment spending as well as changes in other spending categories that may have impacted any such changes.
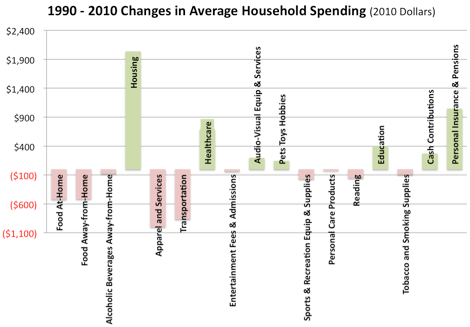
Between 1990 and 2010, households on average only increased their total expenditures by 2%, or $759. Some spending categories have increased, some decreased and some are little changed.
Decreases in the cost of some expenditure items have apparently saved households money that was shifted to other categories of spending. Both food at-home and away-from-home (basically at restaurants) spending decreased by a combined total of over $1,000 per household, almost evenly split between the two categories. Restaurant spending decreased by 17%. Households also spend $999 less in 2010 than 1990 on apparel and apparel services, probably due to the increasing amount of clothing coming from Asian and other lower wage countries, resulting in lower price goods. Transportation has also seen a significant decrease of $865 in annual spending per household. That might surprise you based on current gasoline prices, which are about 50% higher today than in 1990 when adjusted for inflation. A number of factors probably contributed to lower transportation costs including improved vehicle mileage efficiency and people driving fewer miles today than in the past. Also, as hard as it is to believe, the cost of airline tickets (cost per mile) was around 10% lower in 2010 than 1990 when you adjust for inflation.
This reduced household spending has been offset by increased spending for housing (up $2,037, probably due to increased house sizes), health care (up $866), personal insurance and pensions (up $1,049) and education (up $397).
So what changes have occurred to entertainment and recreations spending? When we look at the broad combined category of away-from-home entertainment, sports participation and viewing, memberships in social, recreation, health and other similar type clubs and fees for recreational lessons, spending has decreased by 6%, or $38 per household. Spending has also decreased for sports and recreational equipment and supplies by 32%, or $172. Where entertainment- and leisure-type expenditures have seen an increase is with audio-visual equipment and services (includes television and video game hardware and software), which are basically all activities that take place in the home. Those expenditures increased 26% (+$197), almost exactly the amount by which the two away-from-home entertainment and sports categories cited above decreased.
Also when it comes to predominately at-home leisure, reading expenditures decreased the most of any spending category, by 61% (-$155) while spending on pets, toys and hobbies increased by $146.
Generally what we are seeing is a shift in entertainment, recreation and sports (leisure) spending from away-from-home to at-home and now on mobile devices. In 1990, at-home leisure represented 3.1% of all household expenditures. It grew to 3.5% in 2010. Simultaneously, away-from-home leisure spending decreased from 2.4% to 2.0% of all household spending. Combined, all types of leisure spending, both at-home and away-from-home, have remained unchanged at 5.5% of total household expenditure.
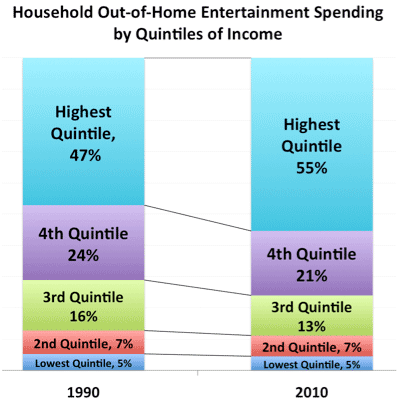
Another shift we found when we dug into the data is that middle-income households, defined as the 3rd and 4th highest quintiles of income, have declined in the percentage of total out-of-home leisure spending they account for and the top 20% of households by income have grown to account for a larger share (also see our article Trends in middle-income entertainment spending). In both 1990 and 2010, the lowest 40% of income households represented only 12% of away-from-home leisure spending, during the 21 years, middle-income households declined from 40% to one-third and the highest income quintile households increased from 47% to 55%. In 2010, the top 20% of households by income ($92,000+) accounted for more than one-half of all such spending.
So what does all this say about the 21-year spending trend for FEC-type centers? We dug down into unpublished detailed Consumer Expenditure Survey spending data to examine community-based (not on trips away-from-home) entertainment spending for fees and admission at entertainment/leisure facilities including family entertainment centers, amusement parks, movie theatres and museums.
Some of the news is good. From 1990 to 2010, there was a slight 4% uptick in average household spending for community-based entertainment. Over the 21 years, the lowest 40% of income households saw a 5% decline in their average spending, middle-income household’s spending declined by 1% (basically unchanged) and spending by the top 20% of households increased by 12%. So basically, all the increased spending came from the highest income households ($92,000+ in 2010). In 2010, those highest income households accounted for approximately half (47%) of all community-based entertainment spending. The average higher income household spent 2.5 times as much as the average middle-income household and almost six times as much as the lowest 40% of income households.
What all this says it that spending growth since 1990 for community-based FEC-type venues has come from higher income families, who now account for about half of all spending, i.e., 20% of households generate half of all FEC-type spending. They are the market to target.
Unfortunately, as we travel the country and are called in to assist struggling location-based entertainment (LBE) facilities (includes FECs, bowling and children’s entertainment centers) and help them grow their business, we see example after example of LBEs that either didn’t recognize that it is the higher socio-economic households who are their true market or who understand that, but just don’t understand how that translates into selecting the best market and location; the quality of facility design, finishes and landscaping; the menu selections and quality of food and beverage offerings and the quality of customer service.
At the same time in our travels, we see LBEs that get it, that successfully attract the higher-socioeconomic market, and as a result, are very successful.
Vol. XII, No. 4, June 2012
- Editor's Corner - International travels
- What a difference 21 years makes with household spending
- New free directory for agritourism businesses
- Sustainability A to Z: Still relevant for both consumers and industry
- Foundations Entertainment University - July 17-19 in Chicago
- The potential of the stay-at-home mother with young child market
- Attracting Generation X
- Theme park attendance is counterintuitive to macro LBE spending trends