
Vol. IV, No. 1, January 2004
- Editor's Corner
- The Experience Economy Means Everyone's Your Next Big Competitor
- Moving from Serving Customers to Facilitating Experiences
- There's Still Time to Save $200 on Foundations Entertainment University
- Serious Food, Outrageous Fun
- Out-of-Home Entertainment Spending Is Increasing
- Children Want to Eat Healthy
- Kids Edu-dining Debuts at Sonic Drive-In
- New Projects
Out-of-Home Entertainment Spending Is Increasing
Married couples with children are increasing their spending for out-of-home entertainment at a faster rate than their overall spending and inflation. Based on our analysis of data from the Bureau of Labor Statistics' Consumer Expenditure Survey (CEX), between 1992 and 2002, married couples with children increased out-of-home entertainment spending at an annual rate of 4.4%. That compared with their 2.9% overall annual spending increase for all expenditures and an average annual inflation rate of 2.5% for the same period. Between 2001 and 2002, out-of-home entertainment spending of married couples with children increased 7.5%, faster than for any other household type. In 2002, married couples with children spent 42% of all spending by all households on out-of-home entertainment.
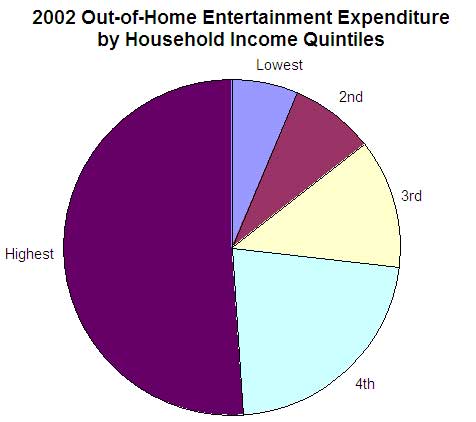
Further analysis of CEX data indicates the greatest amount of spending is by college-educated and high income households. College-graduate households are 26% of all households, yet they account for 52% of all out-of-home entertainment spending. The highest income quintile (20%) of households (about $75,000+) accounts for 51% of all out-of-home entertainment spending. That's more than twice the amount spent by consumers in the fourth income quintile, more than four times the spending of those in the third quintile and more than six times of those in the second quintile. To put it in simple terms, the 20% of households with the highest incomes account for over half of all out-of-home entertainment spending.
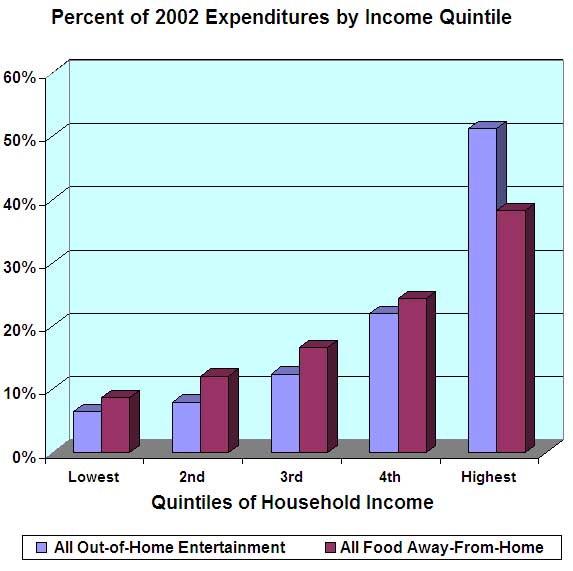
The graph that follows shows the break-down of total 2002 expenditures for both out-of-home entertainment and food away-from-home by each household income quintile.
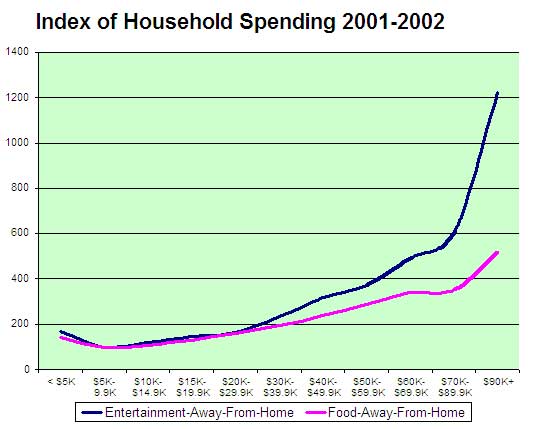
The graph shows the relationship between household income and out-of-home entertainment spending is more dramatic for the highest income quintile than spending on food away-from-home. A compilation of 2001 and 2002 CEX data shows that the highest income households, those with $90,000+ incomes, spent 12 times as much on out-of-home entertainment as the lowest spending income group ($5,000-$9,999), whereas their food away-from-home spending was only five times as great.
The graph that follows shows the index of spending on both out-of-home entertainment and food away-from-home by household income. An index of 100 was assigned to $5,000-$9,999 income households, as they had the lowest spending in both categories. On the graph, an index of 200 would indicate spending at twice that of $5,000-$9,999 income households. An index of 500 would mean five times the spending.
The higher the income, the greater the proportion of all entertainment spending that is spent on out-of-home entertainment. All entertainment spending also includes televisions, audio equipment, pets, toys, playground equipment, entertainment supplies and other entertainment equipment. In 2002, households with $70,000+ incomes spent 31% of all their entertainment spending on out-of-home entertainment, compared to lower percentages for lower income households.
| Annual Household Income | % Out-of-Home of All Entertainment |
|---|---|
| $20,000-$29,999 | 20% |
| $30,000-$39,999 | 19% |
| $40,000-$49,999 | 25% |
| $50,000-$69,999 | 22% |
| $70,000 and over | 31% |
What all this shows is that married couple families with children are a great market for out-of-home entertainment facilities, as they garner 42% of the market. The large bulk of that market is centered on college-educated, white-collar families, those with higher incomes (there is a direct correlation between education and both income and white-collar employment).
Targeting the market of college-educated, white-collar married couples with children offers a double whammy. This group also accounts for 36% of all food away-from-home spending, with $93 billion dollars spent in 2002, even more than that spent by single households. During the past 10 years, away-from-home food spending of married couples with children increased at an annual rate of 4.1%, again faster than overall spending (2.9%) and inflation (2.5% annually). In 2002, this group's food away-from-home expenditures increased 6.5%.
Location-based entertainment facilities that use food as well as entertainment to target upscale families with children will be the big winners in the future, as this market niche represents the greatest spending on both away-from-home entertainment and food. This group's spending should continue to grow at a faster rate than inflation.
Vol. IV, No. 1, January 2004
- Editor's Corner
- The Experience Economy Means Everyone's Your Next Big Competitor
- Moving from Serving Customers to Facilitating Experiences
- There's Still Time to Save $200 on Foundations Entertainment University
- Serious Food, Outrageous Fun
- Out-of-Home Entertainment Spending Is Increasing
- Children Want to Eat Healthy
- Kids Edu-dining Debuts at Sonic Drive-In
- New Projects