
Vol. XVII, No. 1, January 2017
- Editor's Corner
- Are you ready for hygge?
- 2017 Foundations Entertainment University dates
- Top 2016 articles
- The untold truth about feasibility studies
- The growing inequality of entertainment & the growth of eleisure
- What's happening to sports participation?
- Becoming the industry contrarian
- Is a new virtual reality disruption coming to out-of-home leisure?
- Predictions for 2017
- The curse of customer fatigue; the downfall of many CLVs & FECs
The growing inequality of entertainment & the growth of eleisure
During the Presidential campaign we heard a lot about the growing income inequality in the U.S. Our company's research shows there's no doubt it is a growing phenomena. Along with growing income inequality, our company's research finds there is a growing inequality in participation and spending for out-of-home (OOH) entertainment. At the same time, we are also seeing a decline in OOH entertainment across all socioeconomic groups.
There's considerable evidence of both trends. First we'll look at changes to the share of consumers' income that they allocate to spending on OOH entertainment over the last ten years, both in the local community and on trips (the entertainment category also includes cultural and art venues).
Over the past ten years there has been an average one-sixth decline (-16%) in the share of income spent on OOH entertainment by households as a whole. Using educational attainment of the head of household for socioeconomic segmentation shows that all socioeconomic groups have spent a smaller share of their incomes on OOH entertainment. However, the greatest declines have been with the lower socioeconomic households. For example, high school graduates went from spending 0.30% of their income on OOH entertainment in 2006 to 0.16% in 2015, almost a one-half decline (-46%), whereas Bachelor's and higher degree households only dropped from 0.49% to 0.37%, a one-quarter decline (-25%). Master's and profession degree households only saw a slight decline of 8%.
Also, as the below graph clearly shows, the higher the education level, the larger the share of income that is devoted to OOH entertainment. Bachelor's and higher degree households spend more than twice the share of their incomes on OOH entertainment as high school graduate households.
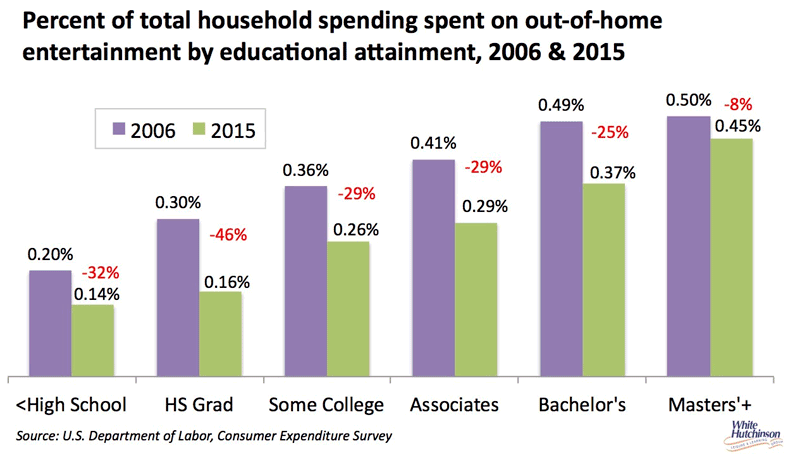
So as a result, Bachelor's and higher degree households with their higher incomes and with aw higher percent of that income devoted to OOH entertainment spending now spend five times as much on OOH entertainment as high school graduates.
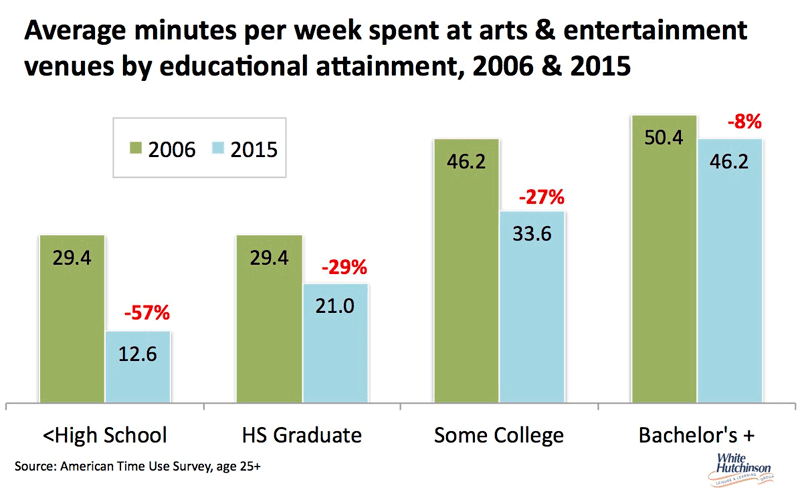
The decline in spending corresponds with a decreasing amount of leisure time that is being spent at OOH entertainment venues. Again, the decrease is inversely related to socioeconomic status; consumers with lower levels of education have cut back the most on the time they spend at OOH entertainment venues.
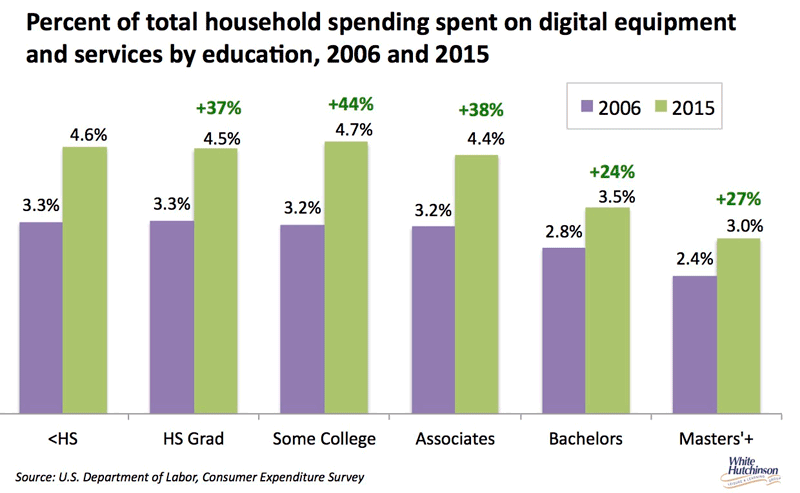
What's interesting is that when we look at spending on at-home and mobile screen-based digital technology (digital equipment, services and subscriptions), the inequality is flipped. The lower socioeconomic households spend a larger share of their income on it than higher socioeconomic households. Over the past 10 years, the share for all socioeconomics has increased. High school graduate households now spend 4.5% of their income on digital technology, 12 times as much as on OOH entertainment, whereas Bachelor's degree households only spend 3.5%, or 10 times as much as they do on OOH entertainment.
What does all this tell us? It strongly suggests that lower socioeconomic households are substituting screen-based entertainment options for OOH entertainment more so than the higher socioeconomic households, who with their higher incomes can afford OOH entertainment. For the lower socioeconomic households who have limited discretionary spending, screen-based entertainment gives them a lot more bang for their buck in terms of the cost per hour (just pennies) compared to visiting an entertainment venue.
Even the higher socioeconomic households are shifting some of their entertainment spending to screen-based versus OOH. What we are seeing is a shift of our entertainment to what could be called eleisure – to all the at-home and mobile screen-based entertainment options that digital technology has brought us. And now we have virtual and augmented reality on the near horizon to offer even more engaging options.
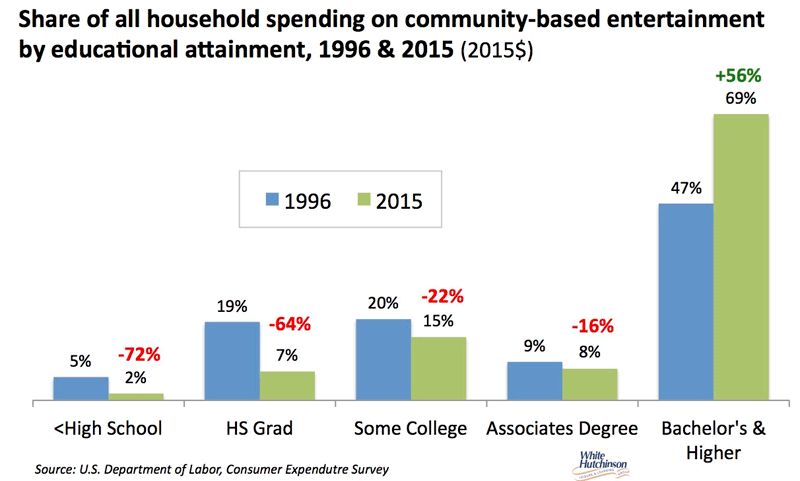
We are seeing a clear trend of an increasingly bifurcated OOH entertainment landscape with a growing share of OOH entertainment spending shifting to higher socioeconomic households while lower socioeconomic groups shift a greater share of their entertainment spending to their screen-based options. Whereas in 2006 high school graduate households accounted for 21% of all OOH entertainment spending, their 2015 share declined to 6% while Bachelor's and higher degree households' share increased from a little less than half (45%) to 69%.
eLeisure is taking away a share of OOH entertainment spending across all socioeconomic groups, but far less so for higher socioeconomic households, the college degree and upper-middle income+ ones. eLeisure is continually raising the bar for what it takes to get people away from their screen options to visit OOH entertainment venues. Success not only now, but also increasingly so in the future, requires offering higher quality options, high fidelity OOH experiences targeting the to higher socioeconomic consumers.
Vol. XVII, No. 1, January 2017
- Editor's Corner
- Are you ready for hygge?
- 2017 Foundations Entertainment University dates
- Top 2016 articles
- The untold truth about feasibility studies
- The growing inequality of entertainment & the growth of eleisure
- What's happening to sports participation?
- Becoming the industry contrarian
- Is a new virtual reality disruption coming to out-of-home leisure?
- Predictions for 2017
- The curse of customer fatigue; the downfall of many CLVs & FECs