
Vol. XIII, No. 8, October 2013
- Editor's corner
- Implications of the new 6th Sense & the flight from conversation
- Meet us in Orlando
- Current project status
- It's time to change the industry's lexicon
- Foundations Entertainment University heading to Phoenix
- Changes to location-based entertainment participation and spending
- Healthy eating on the increase & free newsletter
Changes to location-based entertainment participation and spending
About one month ago our CEO, Randy White, posted one of his blogs with a preview of our analysis of 2012 consumer spending data. His blog announced both the good and bad news – the good news was that household spending for community-based entertainment venues was up, but spending for entertainment on trips was continuing its downhill staycation slide. He promised a more in-depth analysis in this issue of our eNewsletter, so here it is.
Community-based entertainment
First, we’ll examine community-based entertainment (CBE) spending, spending on entertainment at venues such as movie theatres, family entertainment centers, theme parks, zoos and museums within 50 miles of home and not on an overnight trip. Our analyzes are all based on inflation-adjusted spending.
Average household (HH) CBE spending increased by 5% from 2011 to 2012. Average spending is now identical to the rate of spending in 2000, but still 4% lower than its pre-Great Recession level in 2007. When we look at average HH CBE spending for the different quintiles of HH income, we see the continuation of a long-term trend. The highest two HH income quintiles increased their spending and the lowest 60% of income HHs decreased their spending in 2012. Whereas in 2000, the top 40% of income HHs accounted for 64% of all CBE spending, in 2012 their share increased to 70%, with all the growth attributable to the top 20% income group whose share grew from 42% in 2000 to almost one-half (47%) of all such spending in 2012.
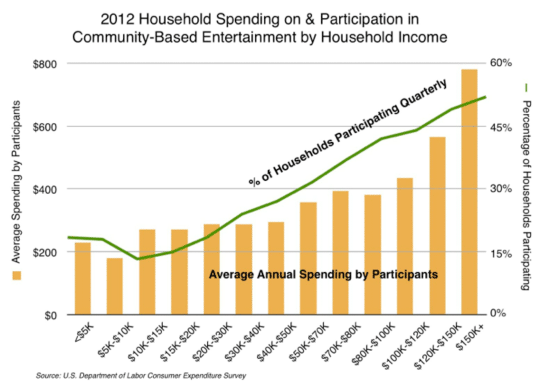
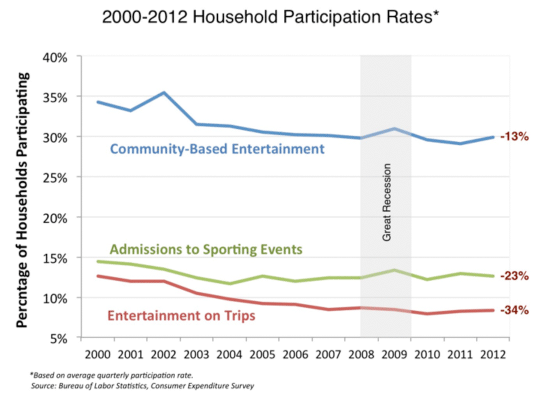
The preceding analysis is based on the average spending by all households. However all HHs don’t attend entertainment venues. So we dug down into the data to examine changes in both the participation rates (average quarterly participating rates each year) and how much those participating (attending) HHs are spending.
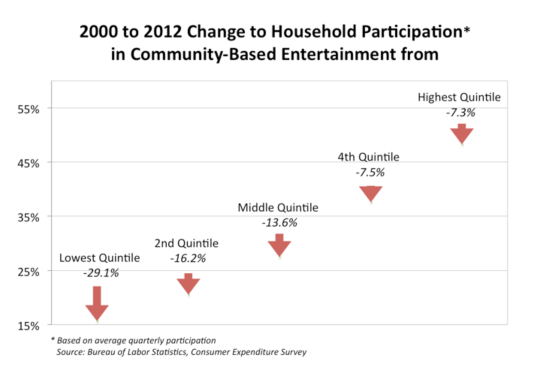
Compared to 2011, all but the lowest HH income quintile increased their participation rates, but only slightly. There is a clear long-term participation trend and it is not good. Since 2000, participation is down by an average of one-eight (13%) for all households—less are attending CBE venues. The percent of HHs that participate as well as the amount of the decrease is inverse to income, the lowest income HHs have both the lowest participation rate and the greatest decrease in participation since 2000.
Fewer households are participating in community-based entertainment, but those that are have increased their spending. The top two income quintiles saw an increase in their spending from 2011 to 2012 while the bottom three quintiles either decreased or were unchanged. Since 2000, all but the lowest income quintile HHs that participated in CBE have increased their spending, with both the absolute dollar amount of increase and the percentage increase being inverse to income.
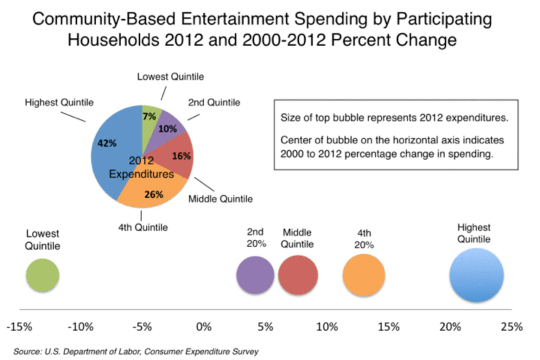
Although the lowest quintile of income HHs only accounted for 1/8 (12%) of the total amount of 2012 CBE spending, those lowest quintile HHs that did participate in CBE spent a little more than one-third (37%) of the amount that the highest income quintile HHs spent.
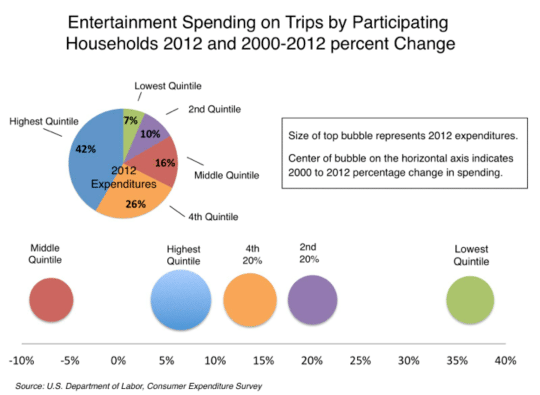
Entertainment on trips
The long-term staycation trend that we have identified as starting back in 1996 continues. Average household spending for entertainment on trips in 2012 declined by another 1%. Average HH participation in trip entertainment stayed flat, but that was only because an increase in the participation rate by the top 40% of income HHs offset a decrease by the lowest 60% of income HHs.
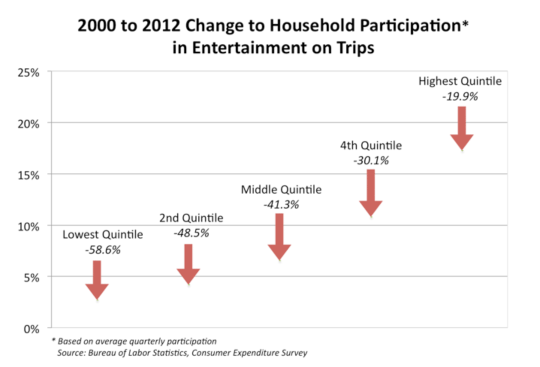
The percentage of HHs participating in trip entertainment has dropped by one-third (34%) since 2000. Every income quintile of HHs has decreased their participation rate in entertainment on trips, while those that do participate have increased their spending with the exception of the middle quintile. Spending by participating HHs in the lowest quintile of income is much closer to the spending rate by the highest quintile households than for CBE spending; it’s three-quarters (77%) of the amount.
Consistent with other out-of-home leisure venues
The long-term trends we are seeing with spending and participation at entertainment venues is consistent with what is happening at other types of leisure venues. Since 2000, average household spending is down at local sporting events and down even more for admissions to sporting events during trips, again with declines being inverse to household incomes. Likewise participation is down more during trips than in the local community and spending is up for those HHs that do attend. Our research has found a similar decline in attendance at National Parks and cinemas.
Summary
This is a lot of information to digest. Here’s what we believe it means. There are several long-term trends in play that show no indication of abating:
- Entertainment spending both locally in the community and on trips is shifting to the highest income households. In 2000, the top 40% of income HHs accounted for 64% of all CBE spending and 67% of all spending on trips. In 2012 those shares had increased to 70% for CBE and 75% of trip spending. This trend is known as social stratification.
- The social stratification spending trend is due to the long-term shift in participation in entertainment. There is a decreasing rate of participation by all income HHs, but the lower the income, the greater the decrease. The top 40% of income HHs have grown in both their share of both CBE and trip entertainment participation, so we have social stratification of participation.
- Those HHs that are participating in entertainment in 2012 are generally spending more than the HHs that participated in 2000. We believe this fits with what we have identified as the bifurcation entertainment market; when people do leave their home for entertainment, they increasing are looking for high quality, what are called High Fidelity experiences and will pay a premium price for it.
Conclusion
Although CBE spending by the average household is holding steady over the long term with some ups and downs, the higher income households are becoming a larger and larger share of all such spending. CBE participation is in a long-term decline with a larger share of participation shifting to higher income households. The market for location-based entertainment is continuing to decrease for entertainment on trips and a larger share of that shrinking market is shifting to higher socioeconomic households. The long-term trends indicate that today and even more so in the future, the lion’s share of location-based entertainment spending will come from higher socioeconomic households attending venues that offer premium, High Fidelity experiences.
Vol. XIII, No. 8, October 2013
- Editor's corner
- Implications of the new 6th Sense & the flight from conversation
- Meet us in Orlando
- Current project status
- It's time to change the industry's lexicon
- Foundations Entertainment University heading to Phoenix
- Changes to location-based entertainment participation and spending
- Healthy eating on the increase & free newsletter