
Vol. IX, No. 9, October / November 2009
- Editor's travelogue: my round-the-world trip
- IAAPA Attractions Expo, November 16-20
- Did entertainment spending really grow in 2008?
- Customized cookies, baked in 2 minutes
- Mass customization in Vietnam
- Attractive female staff could be bad for business
- HOOTERS opens its 1st bowling center
- BellaBoo's gets great reviews
- Soft-modular-play on wheels
- Quarter results for two location-based entertainment chains
- Skee-Ball celebrates 100th anniversary
- Families' favorite restaurants
- Upcoming presentations
Did entertainment spending really grow in 2008?
Sometimes you've got to dig below the surface to learn the truth. Read on to find out what surprising results were uncovered through a little digging into the data on consumer spending �growth� on entertainment last year.
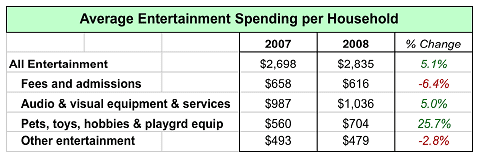
The October 7 edition of The Wall Street Journal included the article, “Families Cut Spending During ’08,” that reported on changes in consumer spending in 2008. The article included the following statement about changes in entertainment spending in 2008:
“One mystery in the data was the 5.1% increase in entertainment spending, a category that seemed like it would have drawn fewer dollars as consumers tightened their budgets to compensate for stagnant wages and the threat of job losses. It equates to about $16.5 billion more spent on entertainment in 2008 than in 2007.”
Unfortunately, the story’s author failed to dig into the U.S. Bureau of Labor Statistics’ Consumer Expenditure Survey (CEX) data to really find out what had happened. You see, the CEX’s definition of entertainment is not the same as most people’s understanding of “entertainment.” We commonly understand it to be out-of-home entertainment (what the CEX calls “fees and admissions”). But the CEX also includes spending on:
- Pets, toys, hobbies and playground equipment
“Pets” includes pet food, pet services, pet toys and accessories, veterinary expenses, etc.; “toys” includes games and tricycles. - Television, radio and sound equipment
- Other entertainment equipment and services
This includes indoor exercise equipment, athletic shoes, bicycles, trailers, purchase and rental of motorized campers and other recreational vehicles, camping equipment, hunting and fishing equipment, sports equipment, boats, boat motors and boat trailers, rental of boats, landing and docking fees, rental and repair of sports equipment, photographic equipment and supplies (film and film processing), photographer fees, repair and rental of photo equipment, fireworks, and pinball and electronic video games.
So when you dig into the data, the picture suddenly changes. It ends up that average household spending on all subcategories of “entertainment” increased with the exception of out-of-home entertainment, which saw a decrease of 6.4%. The pets, toys, hobbies and playground equipment category saw the largest increase of 26%, indicating that the impact of the recession, which took hold psychologically in the second half of 2008, caused consumers to shift their leisure spending and habits to be more home-oriented.
Vol. IX, No. 9, October / November 2009
- Editor's travelogue: my round-the-world trip
- IAAPA Attractions Expo, November 16-20
- Did entertainment spending really grow in 2008?
- Customized cookies, baked in 2 minutes
- Mass customization in Vietnam
- Attractive female staff could be bad for business
- HOOTERS opens its 1st bowling center
- BellaBoo's gets great reviews
- Soft-modular-play on wheels
- Quarter results for two location-based entertainment chains
- Skee-Ball celebrates 100th anniversary
- Families' favorite restaurants
- Upcoming presentations