
Vol. XXIII, No. 6, June 2023
The growing socioeconomic stratification of community OOH entertainment
The socioeconomic stratification of community-based out-of-home (OOH) entertainment venues, including location-based entertainment (LBEs) and family entertainment centers (FECs), has been gradually increasing for over a decade. This shift holds significant importance for developers and operators regarding feasibility studies, venue design, management, and marketing strategies.
The U.S. Consumer Expenditure Survey provides valuable insights into household spending on various leisure activities, including entertainment, cultural events, recreational facilities, and sports. Although their data groups these venues together, we conducted a more detailed analysis to examine the socioeconomic factors influencing household spending on two specific types of venues in local communities:
- Movie theater tickets
- Fees and admissions for theme parks, FECs, museums, and non-live entertainment and cultural venues.
For this analysis, we utilized 2019 data to avoid skewing caused by the pandemic's impact.
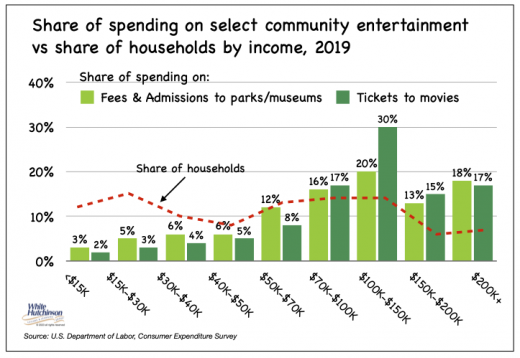
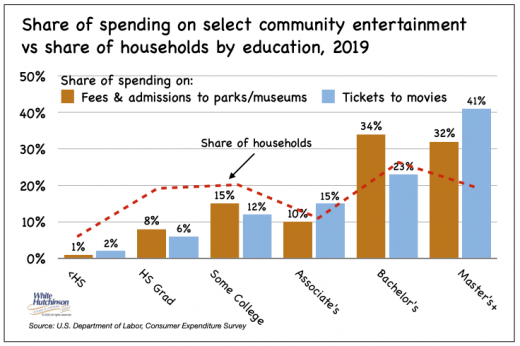
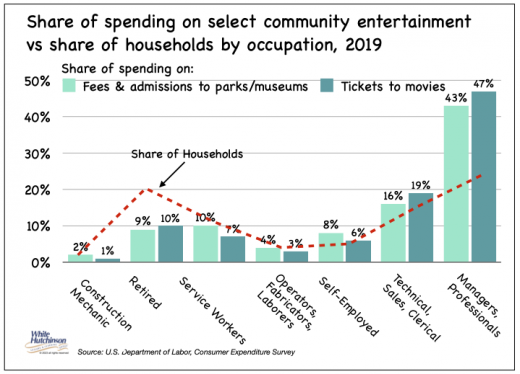
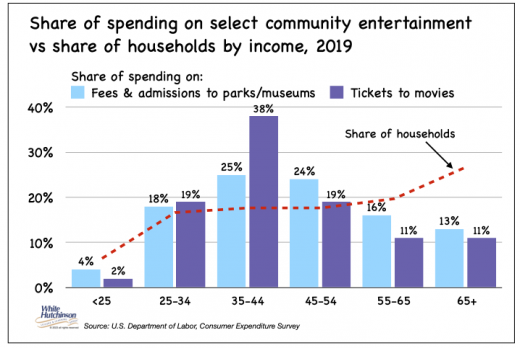
The following examination explores the socioeconomic aspects in four dimensions: household income, education level, age, and occupation. In the share of all spending charts, when the red-dashed line showing the share of all households is below the top of the share of spending vertical bars, that denotes that category of households spends a disproportionally large share of all spending. If the red-dashed line goes above the bars, that means that category of households spends a much smaller share than their share of all households.
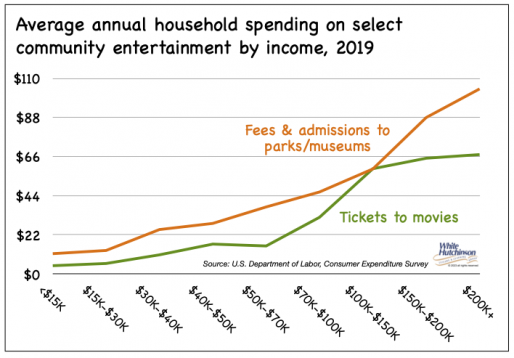
The influence of household income on spending at local cinemas and entertainment and cultural venues (E&C) is evident in the accompanying charts. As household incomes increase, average spending and the share of overall spending also rise. The increase is more pronounced for E&C venues, as they tend to be more costly to attend than movies. Households with incomes above $100,000 account for 27% of all households yet account for 51% of all movie ticket spending and 62% of fees and admissions for E&C venues.
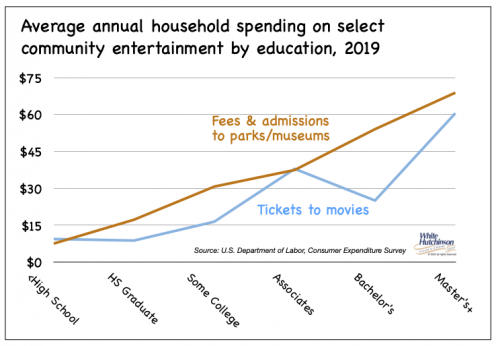
There is a similar pattern based on the education level of households. Those households with a bachelor's degree or higher make up 45% of all households but account for 64% of all movie ticket spending and 66% of E&C fees and admissions.
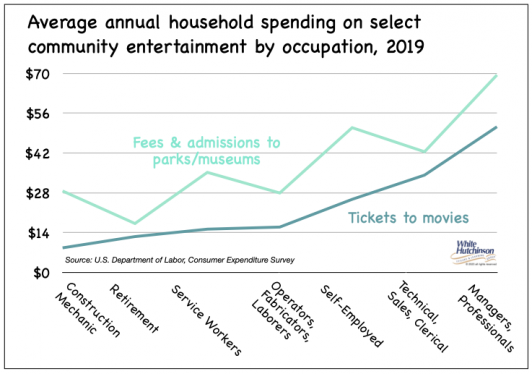
Occupational analysis reveals the same socioeconomic stratification. Managerial and professional households, with an average income of $137,600, represent 25% of all households but contribute to 43% of movie ticket spending and 47% of E&C fees and admissions.
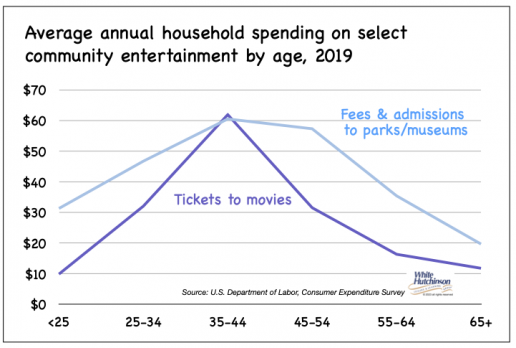
Households headed by individuals aged 35-44 exhibit the highest average spending and the most significant share relative to their overall representation. Despite constituting only 17% of all households, they contribute 25% of movie ticket spending and 38% of fees and admissions for E&C venues. This is partly because this age group has the largest average household size (3.4) and the highest average number of children (1.4), with an average household income of $103,200.
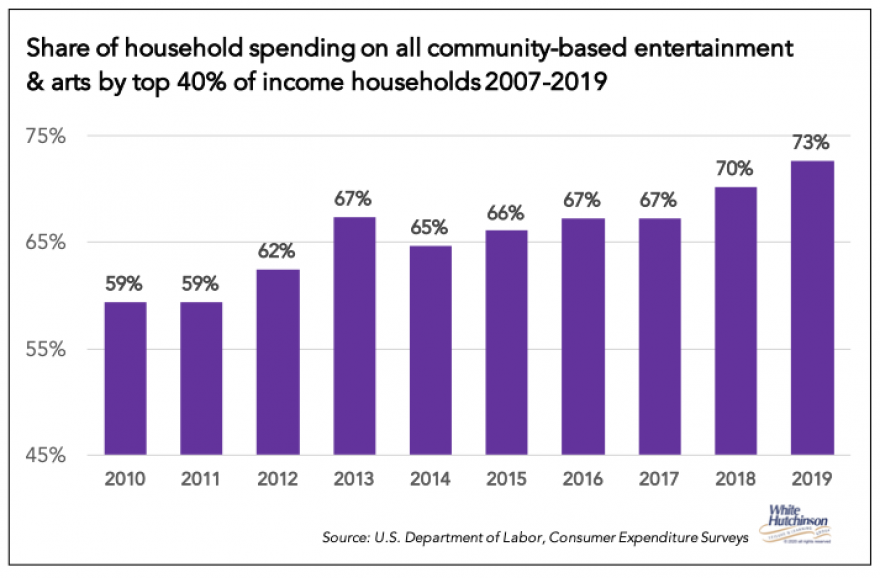
Overall, the socioeconomic stratification of fees and admissions to community-based out-of-home entertainment and cultural venues has increased over time, resulting in increased gentrification. The share of household spending on community out-of-home entertainment and arts by the top 40% of households by income ($72,200+) has increased from 60% in 2010 to 73% in 2019.
Takeaway
The target market for location-based entertainment has become very gentrified. The current high inflation has probably made it even more gentrified than the above analysis shows. Lower socioeconomic households struggle the most due to higher living costs, forcing them to reduce or eliminate any discretionary visits to LBEs. LBE operators need to recognize the target market they need to cater to and design every aspect of their business to attract and satisfy that target market - higher socioeconomic households.
Subscribe to monthly Leisure eNewsletter