Vol. V, No. 8, October 2005
- Editor's corner
- The pizza cone arrives
- IAAPA seminar on designing for children
- Can you hear me now?
- The skyrocketing whole-grain trend
- Cultural faux pas
- Teenage labor force participation continues to decline
- Doing good is good for business
- Kidzania coming to Dubai
- Cinema attendance declines
- Time for leisure
- Agri-motor sport
- Bowling renovation
Time for leisure
There has been a major change in consumers' decision-making about visiting location-based entertainment (LBE) facilities. Not all that many years ago, it was more an issue of capturing a share of consumers' disposable income. Consumers had limited disposable income to spend on out-of-home entertainment, so cost was a major issue. Today, the equation is much different. With higher affluence for a large share of the market, and with consumers feeling time-poor, getting consumers to visit an LBE is now dependent on capturing a share of their limited and valuable disposable free time. Cost is less a factor, provided that a visit is a good value. In fact, many consumers are more worried about making a bad decision and wasting their valuable time than about wasting money. Today, it's an issue of capturing a share of the watch rather than a share of the wallet.
So, if the equation now centers on time more than money, just how much disposable time do consumers have? What is the total time-pie that LBEs need to fight for a slice of?
Fortunately, the Bureau of Labor Statistics with the U.S. Census Bureau recognized the importance of measuring American's time use and began conducting the American Time Use Survey (ATUS) in 2003. ATUS estimates for 2004 are based on interviews with about 14,000 individuals 15 years and older. Each person is interviewed only once and reports activities for the 24-hour period before the interview.
Although there are only two years' worth of results so far, we thought it might prove insightful to take a look at how much disposable time Americans have available for leisure. Here are highlights from ATUS for time spent anywhere eating and drinking and time spent anywhere on leisure and sports. The leisure and sports category includes sports, exercise, recreation, socializing and communicating and all other leisure activities. Socializing and communicating include face-to-face social communication and hosting or attending social functions. Leisure activities include watching television; reading; relaxing or thinking; playing computer, board or card games; using the computer or Internet for personal interest; playing or listening to music; and other activities such as attending arts, cultural and entertainment events.
First we'll look at average hours per day for the entire population of Americans 15 years and older. This and other charts include some subcategories of leisure and sports, meaning they are included in the socializing and sports totals.
Average Hours Per Day
| Weekdays | Weekends & Holidays |
Total All Days | |
|---|---|---|---|
| Eating & drinking | 1.19 | 1.38 | 1.24 |
| Leisure & sports | 4.71 | 6.28 | 5.18 |
| Socializing & communicating | 0.59 | 1.13 | 0.75 |
| Watching television | 2.48 | 3.02 | 2.64 |
| Participating in sports, exercise & recreation | 0.27 | 0.35 | 0.30 |
There are several obvious conclusions from the above chart: people have much more time to eat and drink and participate in leisure and sports on weekends and holidays than on weekdays. Also, watching television consumes about half of all leisure and sports time.
Next we'll take a look at the influence of full-time workers' incomes.
Average Hours Per Day for All Leisure & Sport Activities
| Weekdays | Weekends & Holidays |
Total All Days | |
|---|---|---|---|
| Weekly earnings of full time workers | |||
| 0 - $450 | 3.56 | 5.64 | 4.21 |
| $451 - $675 | 3.42 | 5.96 | 4.21 |
| $676 - $1,050 | 3.45 | 5.82 | 4.17 |
| $1,050 and higher | 3.05 | 5.70 | 3.84 |
The lowest income workers have about 10% more time for leisure and sports than the highest income workers. Most of this extra time is available on weekdays. On weekends and holidays, the higher income workers spend more time on leisure and sports activities.
Now let's see what influence education has. This chart is for all people, whether employed full or part time or not employed.
Average Hours Per Day for All Leisure & Sport Activities
| Weekdays | Weekends & Holidays |
Total All Days | |
|---|---|---|---|
| Educational Attainment - 25 yrs & over | |||
| Less than high school diploma | 5.91 | 6.57 | 6.13 |
| High school graduate, no college | 5.07 | 6.38 | 5.45 |
| Some college or assoc. degree | 4.37 | 6.16 | 4.89 |
| Bachelor's degree or higher | 3.73 | 5.85 | 4.33 |
This chart shows a picture much more dramatic than the preceding income chart. The most highly educated Americans spend much less time for leisure and sports than the least educated. In fact, someone with a Bachelor's degree spends 29% less time on leisure and sports than someone who hasn't graduated from high school and 20% less time than a high school graduate. The largest difference occur on weekdays, but even on weekends and holidays, college graduates spend 8% less time than high school graduates on leisure and sports.
So what influence does having children in the household have on time spent in leisure and sports?
Average Hours Per Day for All Leisure & Sport Activities
| Weekdays | Weekends & Holidays |
Total All Days | |
|---|---|---|---|
| Presence and age of children | |||
| No household children under 18 | 5.32 | 6.75 | 5.74 |
| Household children under 18 | 3.79 | 5.62 | 4.35 |
| Children 13-17 yrs, none younger | 4.03 | 6.24 | 4.62 |
| Children 6-12 yrs. None younger | 3.91 | 5.81 | 4.50 |
| Youngest child under 6 years | 3.54 | 5.17 | 4.06 |
Any parent would confirm what the above chart shows. The presence of children and the younger the children in the home, the less time parents have for leisure and sports activities. The most dramatic difference occurs on weekdays. Households with children under 18 spend 28% less time on leisure and sports. On weekends and holidays, the difference drops to 18%.
Finally, what differences are there between the first ATUS in 2003 and the 2004 one - are there any trends in the time use changes?
Average Hours Per Day
| 2003 | 2004 | |
|---|---|---|
| Eating & drinking | 1.21 | 1.24 |
| Leisure & sports | 5.11 | 5.18 |
| Socializing & communicating | 0.78 | 0.75 |
| Watching television | 2.57 | 2.64 |
| Participating in sports, exercise & recreation | 0.30 | 0.30 |
We're spending 2.5% more time eating and drinking and 3% more time watching television. Could the time study be verifying a root cause of American's growing waistlines?
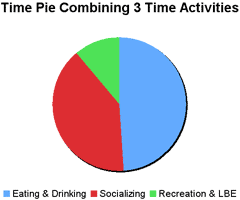
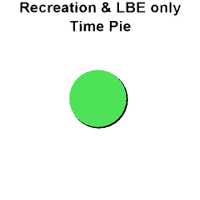
What does all this mean to location-based entertainment (LBEs)? First of all, the couch is a powerful magnet, gluing people to their televisions and taking up about half their leisure and sports time. People need a compelling reason to leave the comfort of their couches, get into their cars and drive to an LBE. Second, with limited time for leisure and sports, especially for families with children, creating a multi-tasking occasion has a greater chance of getting a slice of their leisure time than being singularly focused. If the LBE has great food and beverage, it can capture some of their eating and drinking time. Combine that with entertainment, and a place seen as conducive to socializing and communicating (see article Can you hear me now?), and families will see the LBE as a better option for the use of their limited time. Therefore, the time-pie you are competing for will be larger, so a smaller slice can add up to a lot more business than an even larger slice of a smaller pie that is for only one activity, whether it be eating and drinking or leisure and sports.
A facility that offers food & beverage, entertainment and socialization is competing for a slice of a time pie that is much larger than the time pie for only entertainment


We plan to give continuing coverage to ATUS in future issues.
Vol. V, No. 8, October 2005
- Editor's corner
- The pizza cone arrives
- IAAPA seminar on designing for children
- Can you hear me now?
- The skyrocketing whole-grain trend
- Cultural faux pas
- Teenage labor force participation continues to decline
- Doing good is good for business
- Kidzania coming to Dubai
- Cinema attendance declines
- Time for leisure
- Agri-motor sport
- Bowling renovation


