Vol. V, No. 3, April 2005
- Editor's corner
- Androcentrism: the curse of male-bias
- Construction costs escalate
- Foundations Entertainment University just weeks away
- Golden anniversary for largest operator of LBEs
- Insights from Yankelovich
- What a difference 'highly satisfied' makes
- Speed of service
- Away-from-home entertainment spending
- Worldwide universality of play
- Dairy Queen partners with Nickelodeon
- Why families go out to eat
- New projects
Away-from-home entertainment spending
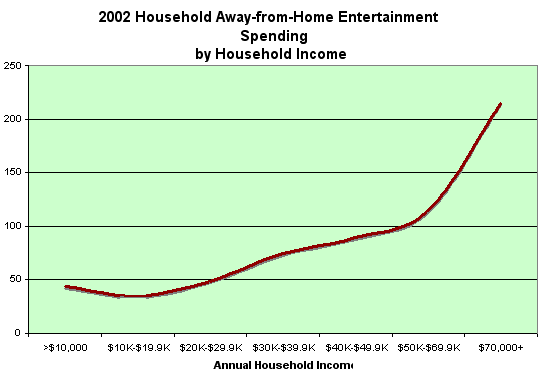
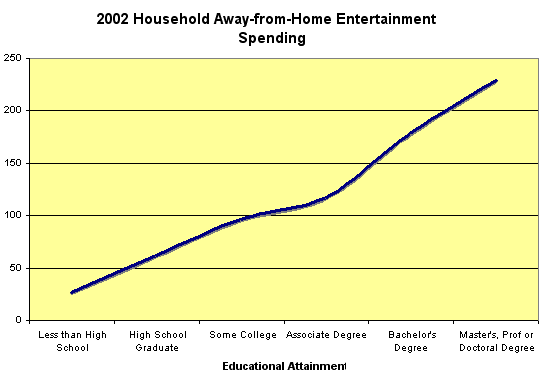
Everyone loves entertainment and the opportunity to have fun away from home. However, there is a direct correlation between how much people spend on away-from-home entertainment and both their income and educational attainment (the two are highly correlated). The two graphs below show the variation in away-from-home entertainment spending for things like movies, family entertainment centers, theme parks and theatre. The graphs plot the index for spending. An index of 100 is the average spending. An index of 200 means twice the average.


As income and education level increase, so does the amount spent on entertainment. For example, households with $50,000 to $69,999 incomes spend 54% more than households with $30,000 to $39,999 incomes. Households with a head of household with a Bachelor's Degree spend almost 2-1/2 times as much on entertainment as high school graduate households.
Here's another way to look at the difference. Households with $50,000 incomes and higher control 65% of all away-from-home entertainment spending, and households with some college degree account for 58% of away-from-home entertainment spending.
The above data illustrates two points:
- Simply looking at total population counts in feasibility studies can be very dangerous. To really understand the potential of a market, you have to drill down into the details of the demographics and socio-economics.
- Designing for niche socio-economic groups is very important to make
sure you attract the socio-economic groups that have the bucks to spend.
Trying to be all things to all socio-economic groups is a sure road
to ruin. To succeed, you need to be Number 1 to someone.
Vol. V, No. 3, April 2005
- Editor's corner
- Androcentrism: the curse of male-bias
- Construction costs escalate
- Foundations Entertainment University just weeks away
- Golden anniversary for largest operator of LBEs
- Insights from Yankelovich
- What a difference 'highly satisfied' makes
- Speed of service
- Away-from-home entertainment spending
- Worldwide universality of play
- Dairy Queen partners with Nickelodeon
- Why families go out to eat
- New projects


