
Vol. XIV, No. 3, April 2014
Do you really know who your competition is?
When our company first started working in the location-based entertainment industry 25 years ago, it was easy to identify who the competition was for our market feasibility studies. We just identified other location-based entertainment venues in the trade areas, such as other family entertainment centers, bowling alleys, children’s entertainment centers, etc. And except for the bowling alleys, there were usually few if any FEC-type venues to identify and consider as competition.
Then, maybe around a decade or so ago, we noticed that Chuck E. Cheese’s in their quarterly investor calls was claiming that G and PG movies were competition. CEC often cited an increase in G and PG movies at the cinemas as one of the causes when their comparable store sales were not so good. But even then, the competition was still being considered as other out-of-home venues.
Digital technology expands the options
Things have dramatically changed since then with the explosion of digital technology in the form of what is called the Triple Revolution – the Internet, social media and mobile devices (predominately the smartphone). Just think about it, the smartphone is less than seven years old and in such a short period of time it, along with all its apps, has become a ubiquitous part of our lives and radically transformed our interaction with the world and each other. The Triple Revolution in the past few years has brought us so many more entertainment options.
Now, when our company does feasibility work and designs and produces location-based leisure projects for our clients, we have to consider digital technology when we identify their competition. Anything, yes anything, people can do in their leisure time is competition for a location-based leisure facility.
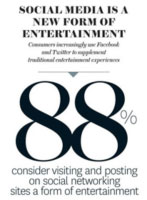
It’s now come down to “so little time and so many things I can do,” and even more importantly there are so many other things you can do, at home or even anywhere you are on your smartphone including entertainment options. And that entertainment is not limited to what you would call the tradition definition of entertainment. For example, 88% of social media users consider visiting and posting on social media a form of entertainment.
Digital winning the dollars

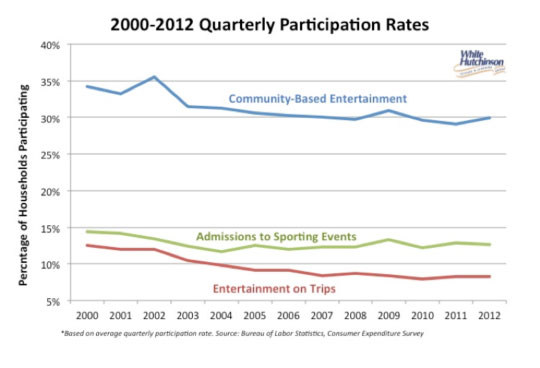
Our company has extensive research data showing that spending on digital technology is far outpacing and gaining an increasing share of what you could call disposable entertainment spending. Between 2000 and 2012, average household spending (in 2012 dollars) for admissions to all forms of location-based entertainment (LBEs) using a broad category of entertainment, including theme parks, FECs, cinema, museums, zoos and even sporting events, decreased by $32 whereas spending for all forms of digital and electronic technology and services, including both in-home and mobile, increased by $754. Over those 12 years, average household spending on the broad category of entertainment increased by 47%, yet location-based venues saw not only a decrease in spending, but also a decline from 18% to 11% of all such spending in 2012.
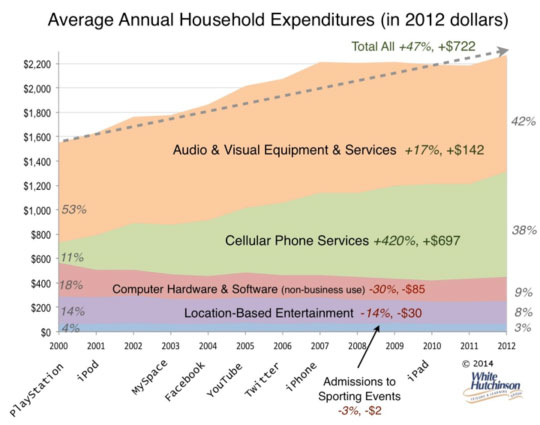
What has changed is that now less people are going out to location-based entertainment venues – the participation rate has declined. Between 2000 and 2012, the number of households that visited a LBE at least once during a 3-month period decreased by one-eight (12%). People now have so many digital alternatives. Digital disruption is resulting in the US population spending less of their entertainment time at LBEs and more time with digital options.
Now it’s a Zero Sum games
So while the one graph shows the battle for disposable entertainment dollars, especially for the higher socioeconomic segment of the population that has disposable income to spend on entertainment, its becoming even more of a battle for disposable leisure time. That makes it a Zero Sum game, as people only have a fixed amount of available leisure time.
The amount of leisure time people have has varied little over the years, hovering at a little over an average of five hours per day. Between 2003 and 2012, it only increased on average from 5 hours-7 minutes to 5 hours-22 minutes per day, and most of the increase was attributable to an increase in the number of people unemployed, who, for the most part, had more leisure time.
Research by Scott Wallsten from the Technology Policy Institute just last year found that online activities (time using the internet or online leisure time spent doing things like combing social networks, browsing for non-work purposes and instant messaging, etc., but not playing games) on computers and mobile devices is displacing time spent at real world leisure experiences. He found that each hour of online leisure displaced 17.5 minutes of offline leisure. And when he analyzed the impact by income, what he called the crowdout effect was inversely proportional – leisure time online replaced more offline leisure time for lower income people than higher income people. This makes sense, as digital online leisure is a very inexpensive, sometimes free option making it ideal for people whose disposable dollars are very limited.
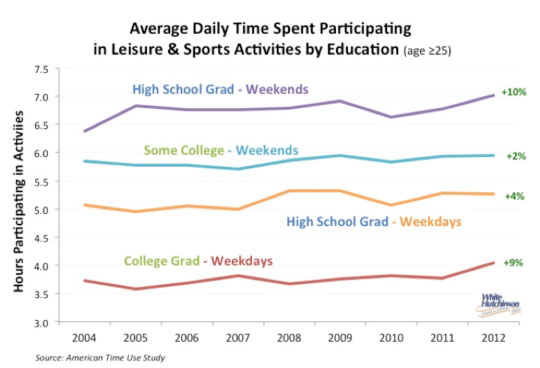
LBE’s fight for a share of leisure time gets even fiercer when we look at differences based on education (which is basically proportional to incomes). Back in 1965, men with a college degree had a bit more leisure time than men who had only completed high school. By the early 2000s, that had reversed. In 2003, high school graduates age 25+ had an average of 5-hours, 22-minutes of leisure time a day, 25% more (one-hour, 4-minutes more) than people with a Bachelor’s or higher degree. Since then, both groups have seen a slight increase in leisure time, but the 25% disparity remains. The disparity is true on both weekdays and weekends and holidays.
So what we have is the socioeconomic group with the highest incomes and the most disposable income to spend on entertainment having the least amount of leisure time when they can do so.
But now for what is some good news to offset that trend. Compared to maybe a half-century or so ago, work today is more knowledge-intensive and intellectual. There are fewer dull manual jobs and more glamorous ones, such as those in all the different design and creative lines of work. That means that for more people than ever, especially the more educated, work is enjoyable, satisfying and pleasurable. Research shows that the occupations in which people are the least happy are manual and service jobs requiring little skill. Arlie Russell Hochschild at the University of California, Berkeley suggests that as work becomes more intellectually stimulating, people start to enjoy it more than home life and people often feel that lingering at home is non-productive, so they indulge in less passive leisure, such as watching TV. For the limited leisure time they do have, they want it to be more interactive, engaging and rewarding.
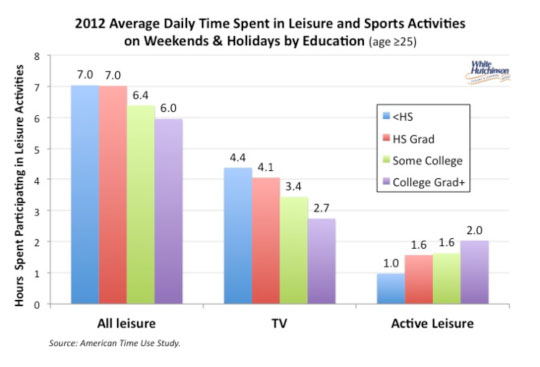
This is born out by their time use. The higher the education level, the lower both the amount and the percentage of leisure time that is spent on the passive activity of watching television and the greater the amount and percentage of time spent on more engaging and rewarding leisure. On weekends and holidays, college graduates spend 1/3 less time watching and 25% more time engaged in active leisure activities than high school graduates. The differences are even greater on weekdays.
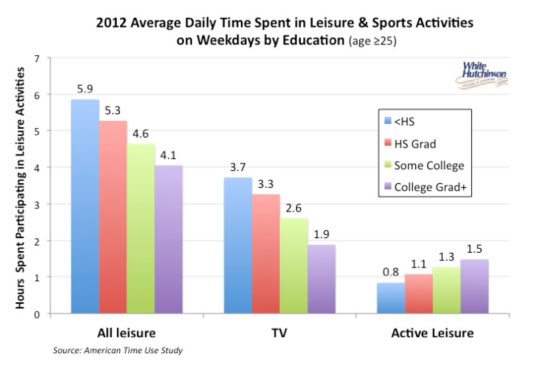
So what we found is that the greater amount of leisure time the less educated (and lower socioeconomic) have compared to the more educated (and higher socioeconomic) is mostly used for television viewing. And the higher educated, who have less overall leisure time, actually spend more total time in active, engaging type leisure activities than the less educated.
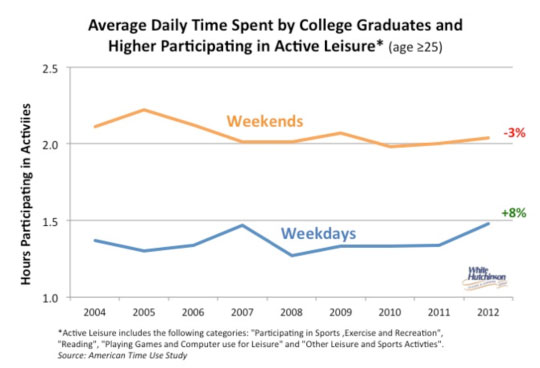
The amount of active leisure time college graduates have has increased on weekdays, but decreased lightly on weekends.
What this means if you are in or planning to become part of the location-based entertainment, eatertainment, or more appropriately-called location-based experience business, and want to attract the higher socioeconomic customers who control the lions’ share of LBE spending (the 28% of all households with $80,000+ incomes account for 57% of all entertainment fees and admission spending), you need to design all aspects of their experience at the LBE to be very engaging and as active and stimulating as possible, what could be called immersive. In fact, immersive experiences were one of the top 10 trends for 2014 identified by JWT Intelligence. Also, in terms of the quality of the experience, it needs to be High Fidelity, a premium experience, in order to lure today’s consumers away from all their digital entertainment options and out of their homes to visit an LBE.
There is another important dimension to attracting today’s consumers to an LBE. It’s about helping them save time, but that’s a topic for a future article.
Additional reading:
- Immersive Experiences:
- High Fidelity: