Vol. VII, No. 2, February/April 2007
- Editor's corner
- Restaurant and entertainment expenditures
- New "networked" consumer more fluid and connected
- Knuckleheads eatertainment center opens in Wisconsin Dells
- Never old
- Foundations Entertainment University - April 24-26
- Wannado reduces prices
- Cultural differences
- American food goes upscale
- Visible glove use gives good impression
- Hero's The Party Experience
- Restaurant failures: The truth and the reasons
- Starbucks' 5 core principles for success
- McLattes on the way
- The silliness of most surveys
- New projects
Restaurant and entertainment expenditures
Who spends more on going out to eat, couples with no children or families with young children? How about when you add families with older children to the mix? And who spends the most on entertainment? Read this article and you'll be in-the-know.
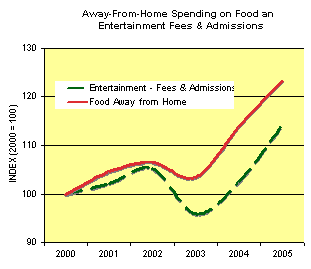
Consumers continue to increase their spending for both food purchased away from home, predominately in restaurants, and for fees and admissions for entertainment. The graph below shows the increase in expenditures since 2000. Spending in 2000 equals an index of 100. In 2005, expenditures had increased 23% (index 123) for away-from-home food and 14% (index 114) for fees and admissions.
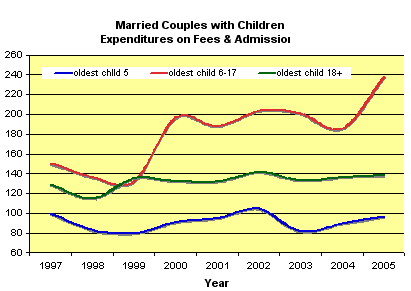
The following graph shows spending growth since 1997 for married couples with children by the age of the oldest child. The graph shows the index of spending compared to 1997 spending by married couples with children younger than 6 (index 100). The greatest growth for away-from-home entertainment spending among married couples with children has been for couples with the oldest child between the ages of 6 and 17, where spending increased 57%.
The following two graphs show the 2005 spending break-down, based upon the type of household. The first pair of bars in each chart shows spending for all married couples with children. The next three pairs of bars show the breakdown for married couples with children, based on the age of the oldest child, followed by other types of households.
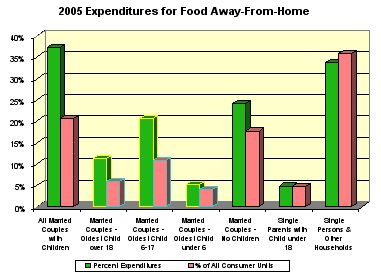
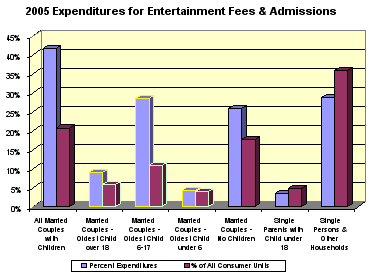
Married couples with the oldest child between age 6 and 17 have the highest spending per household for entertainment fees and admissions at 262% of average. These couples also rank second highest for away-from-home food at 191% of average. The highest food away-from-home spending is for married couples with the oldest child over 18, at 192% of average.
Vol. VII, No. 2, February/April 2007
- Editor's corner
- Restaurant and entertainment expenditures
- New "networked" consumer more fluid and connected
- Knuckleheads eatertainment center opens in Wisconsin Dells
- Never old
- Foundations Entertainment University - April 24-26
- Wannado reduces prices
- Cultural differences
- American food goes upscale
- Visible glove use gives good impression
- Hero's The Party Experience
- Restaurant failures: The truth and the reasons
- Starbucks' 5 core principles for success
- McLattes on the way
- The silliness of most surveys
- New projects